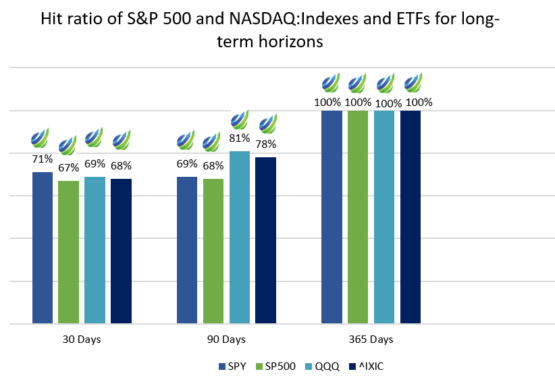
Stock Market Forecast: S&P 500 & Nasdaq – Accuracy Up To 100%

Stock Market Predictions Highlights:

  • The best hit Ratio is 100% for the 365-day time horizon both of Nasdaq ETF (QQQ) and S&P500 (IXIC)
  • Our performance evaluation period covers the Covid-19 times, yet all the forecasts are still more than 60% accurate for all time horizons.

Read more

Apple Stock Forecast: 2020 Remains A Prosperous Year for AAPL Stock

Habiba MohamedThis Apple stock forecast article was written by Habiba Mohamed – Junior Analyst at I Know First.

Summary:

  • Apple showed robust returns in the Q3 financial statement showing an increase of 11% from the year-go quarter
  • A stock split in AAPL stocks is helping in boosting the desire of buying Apple shares
  • 5G initiation is the biggest innovation in phones’ history, that will result in an increase in the AAPL stock price 

premiumRead The Full Premium Article

Subscribe to receive exclusive PREMIUM content here

Apple Stock Forecast: AI-Powered Algorithm Maintains High Accuracy

Executive Summary:

This evaluation report will present a demonstration of the performance of the Apple stock forecast generated by the I know First AI Algorithm for the AAPL stock with time ranging from 3 days to 1 year, which were delivered on a daily basis to our clients. The following analysis will be covering the time period from June 1, 2019 through Sep 13, 2020. Here is a comprehensive display of the hit ratios of our AAPL predictions in the stock market.

Highlights:

  • 100% Hit ratio for the one-year time period gives our clients the confidence to invest with less risk
  • Predictions are always above 62% precision regardless of market volatility
  • In accordance with our Al predictions, the stock price increased by 155.90% over the studied time interval

Read Full Report

Aggressive Stocks: Daily Forecast Evaluation Report

Executive Summary

In this stock market forecast evaluation report, we will examine the performance of the forecasts generated by the I Know First AI Algorithm for the Aggressive stocks for long and short positions which were sent daily to our customers. Our analysis covers the period from December 20, 2019, to September 9th, 2020. 

Chart 1: Performance comparison for Top 20, Top 10 and Top 5 signals for Aggressive stocks vs S&P 500 for short term horizons since December 20th, 2020 until September 9th, 2020
Chart 2: Performance comparison for Top 20, Top 10 and Top 5 signals for Aggressive stocks vs S&P 500 for long term horizons since December 20th, 2020 until September 9th, 2020

Top Aggressive Stocks Highlights

  • The Top 20, Top 10, and Top 5 signal groups generated by I Know First consistently outperformed S&P 500 Index for the short and long term horizons.
  • All the groups returns had a good performance, especially the ones for the 3 Months time horizon. Every group registered a return higher than 10%.
  • The Top 5 signal group outperformed the S&P 500 for almost 9 times for the 14 days time horizon.

Top S&P 500 Stocks: Daily Forecast Performance Evaluation Report

In this stock market forecast evaluation report, we will examine the performance of the forecasts generated by the I Know First AI Algorithm for the S&P 500 stocks for long and short positions which were sent daily to our customers. Our analysis covers the period from October 9, 2018, to July 19th, 2020 and further analyzes the performance of the S&P stocks predictions for long and short positions and only long position. 

Chart 1: Performance comparison for Top 20, Top 10 and Top 5 signals by Daily Model for only long position vs. S&P 500 for short-term horizons from October 9, 2018, until July 19th, 2020.
Chart 2: Performance comparison for Top 20, Top 10 and Top 5 signals by Daily Model for only long position vs. S&P 500 for long-term horizons from October 9, 2018, until July 19th, 2020.
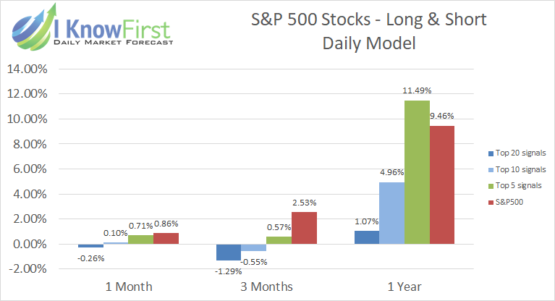
Chart 3: Performance comparison for Top 20, Top 10 and Top 5 signals by Daily Model for long & short positions vs S&P 500 for short-term horizons from October 9, 2018, until July 19th, 2020
Chart 4: Performance comparison for Top 20, Top 10 and Top 5 signals by Daily Model for long & short positions vs S&P 500 for long term horizons from October 9, 2018, until July 19th, 2020.

S&P 500 Stocks Highlights

  • In the short term horizons, all groups' signals outperformed the S&P 500.
  • Our highest signals tend to have the largest returns over short term time horizons and over year long periods. 
  • Only long positions had higher returns than the Long and Short for each time horizon.  
  • Every signal group across every time horizon gave a hit ratio over 53%, showing consistent and reliable accuracy.
  • Our top-5 signals had returns of 12.80% (Long Only) and 11.49% (Long and Short) over year long periods, handily beating the S&P 500 index. 

Read more

Brazil Stock Market: Daily Forecast Evaluation Report

Executive Summary

In this stock market forecast evaluation report, we will examine the performance of the forecasts generated by the I Know First AI Algorithm for Brazilian stocks for long and short positions (20 stocks) which were sent daily to our customers. Our analysis covers the period from January 1st, 2018, to June 30th, 2020.

Brazil stock market
Chart 1: Performance comparison for Top 20, Top 10 and Top 5 long position signals by Daily Model vs Bovespa Index for short term horizons since January 1st, 2018 until June 30th, 2020
Brazil stock market
Chart 2: Performance comparison for Top 20, Top 10 and Top 5 long position signals by Daily Model vs Bovespa Index for long term horizons since January 1st, 2018 until June 30th, 2020
Brazil stock market
Chart 3: Performance comparison for Top 20, Top 10 and Top 5 long and short position signals by Daily Model vs Bovespa Index for short term horizons since January 1st, 2018 until June 30th, 2020
Brazil stock market
Chart 4: Performance comparison for Top 20, Top 10 and Top 5 long and short position signals by Daily Model vs Bovespa Index for long term horizons since January 1st, 2018 until June 30th, 2020

Brazilian Stocks Highlights

  • The Top 20, Top 10, and Top 5 signal groups generated by I Know First consistently outperformed Bovespa Index for almost all time horizons.
  • The Top 5 signal group outperformed the Bovespa by 16.23% using the 1 year time horizon.
  • All hit ratios for 7 day time horizon or longer are above 50%.
  • Using only long positions, every signal group for every time horizon outperformed Bovespa.
  • For long positions only, the top 5 signals with a 1 year time horizon outperformed the Bovespa Index by 21.07%.
  • Long position hit ratios for all time horizons longer than 3 days are above 50% and all 1 year forecast hit ratios are above 70%

Read more

Coronavirus Stocks: Daily Forecast Evaluation Report

Executive Summary

In this stock market forecast evaluation report, we will examine the performance of the forecasts generated by the I Know First AI Algorithm for Coronavirus related stocks for long and short positions (20 stocks) which were sent daily to our customers. Our analysis covers the period from March 4th, 2020, to July 19th, 2020.

Chart 1: Performance comparison for Top 20, Top 10 and Top 5 long position signals by Daily Model vs S&P 500 for short term horizons since March 4th, 2020 until July 19th, 2020
Chart 2: Performance comparison for Top 20, Top 10 and Top 5 long position signals by Daily Model vs S&P 500 for long term horizons since March 4th, 2020 until July 19th, 2020
Chart 3: Performance comparison for Top 20, Top 10 and Top 5 long and short position signals by Daily Model vs S&P 500 for short term horizons since March 4th, 2020 until July 19th, 2020
Chart 4: Performance comparison for Top 20, Top 10 and Top 5 long and short position signals by Daily Model vs S&P 500 for long term horizons since March 4th, 2020 until July 19th, 2020

Top Coronavirus Stocks Highlights

  • The Top 20, Top 10, and Top 5 signal groups generated by I Know First consistently outperformed S&P 500 Index for all five time horizons.
  • The Top 5 signal group outperformed the S&P 500 by 32.84% using the 3 month time horizon.
  • All hit ratios, except for the top 5 signal one week forecast, are above 50%. All three month hit ratios are above 60%.
  • Using only long positions, returns across every signal group and time horizon drastically increased
  • For long positions only, the top 5 signals with a 3 month time horizon outperformed the S&P 500 by over 75%.
  • Long position hit ratios for all time horizons are above 50% and all 3 month forecast hit ratios are above 85%

Read more