
I Know First Live Forecast Evaluation Report For Under 10 Dollars Stocks Package

This performance evaluation for the Under 10 Dollars stocks package was written by Diana Na Kyoung Lee, an Applied Math-Computer Science student at Brown University.
Executive Summary

In this forecast evaluation report, we will examine the performance of the forecasts generated by the I Know First AI Algorithm for stocks from the Stocks Under 10 Dollars Package, which is sent to our customers on a daily basis. Our analysis covers the time period from 1 April 2018 to 31 May 2019. We will start with an introduction to our asset picking and benchmarking methods and then apply it to the stock universe of all of the stocks covered by us in the Under 10 Dollars Package. We will then compare returns based on our algorithm with the benchmark performance over the same period.
About the I Know First Algorithm
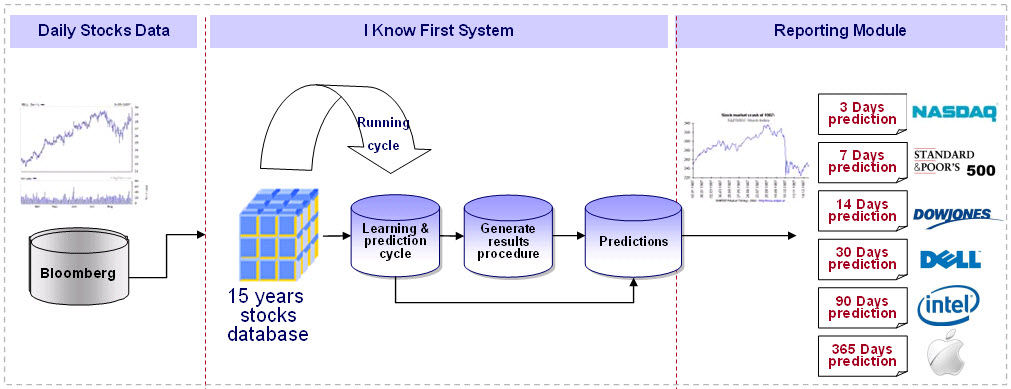
The I Know First self-learning algorithm analyzes, models, and predicts the capital market, including stocks, bonds, currencies, commodities and interest rates markets. The algorithm is based on Artificial Intelligence (AI) and Machine Learning (ML), and incorporates elements of Artificial Neural Networks and Genetic Algorithms.
The system outputs the predicted trend as a number, positive or negative, along with a wave chart that predicts how the waves will overlap the trend. This helps the trader to decide which direction to trade, at what point to enter the trade, and when to exit. Since the model is 100% empirical, the results are based only on factual data, thereby avoiding any biases or emotions that may accompany human derived assumptions. The human factor is only involved in building the mathematical framework and providing the initial set of inputs and outputs to the system. The algorithm produces a forecast with a signal and a predictability indicator. The signal is the number in the middle of the box. The predictability is the number at the bottom of the box. At the top, a specific asset is identified. This format is consistent across all predictions.
Our algorithm provides two independent indicators for each asset – signal and predictability.
The signal is the predicted strength and direction of movement of the asset. This is measured from -inf to +inf.
The predictability indicates our confidence in that result. It is a Pearson correlation coefficient between past algorithmic performance and actual market movement. This is measured from -1 to 1.
You can find a detailed description of our heatmap here.
The Asset Picking Method
The method in this evaluation is as follows:
To fully utilise information provided by our forecast, we filter out the top X most predictable assets and rank them according to their predictability value. Thereafter, from them, we pick the top Y highest signals and re-adjust the rankings accordingly.
By doing so we focus on the most predictable assets on the one hand, while capturing the ones with the highest signal on the other.
For example, a top 30 predictability filter with a top 10 signal filter means that on each day we take only the 30 most predictable assets from our asset universe, and then we pick from them the top 10 assets with the highest absolute signals. On the other hand, a top 30 predictability filter with a top 30 signal filter would imply that we are solely filtering based on predictability, since we are selecting all assets in this particular set which have already been filtered by predictability.
We use absolute signals since these strategies are long and short ones. If the signal is positive, then we buy assets, i.e. open long position and, if negative, we open short position on such asset. This is to help us to identify the assets with the maximum magnitude of change, which is indiscriminate as to whether one adopts a short or long position.
The Performance Evaluation Method
We perform evaluations on the individual forecast level. This means that we calculate the return of each forecast we have issued for each horizon in the testing period. We then take the average of those results based on our positions on different assets and forecast horizon.
For example, to evaluate the performance of our 1-month forecasts, we calculate the return of each trade by using this formula:

This simulates a client purchasing the asset on the day we issue our prediction and selling it exactly 1 month in the future from that day.
We iterate this calculation for all trading days in the analyzed period and average the results.
Note that this evaluation does not take a set portfolio and follow it. This is a different evaluation method at the individual forecast level.
The Benchmarking Method
The theory behind our benchmarking method is the “Null hypothesis,” meaning buying every asset in the particular asset universe regardless of our I Know First indicators.
In comparison, only when our signals are of high signal strength and high predictability, then the particular asset should be bought (or shorted).
The ratio of our signals trading results to benchmark results indicates the quality of the system and our indicators.
Example: A benchmark for the 3d horizon means buy on each day and sell exactly 3 business days afterwards. We then average the results to get the benchmark. This is in order to get an apples to apples comparison.
Asset Universe Under Evaluation: Under 10 Dollars
In this report, we conduct testing for stocks that I Know First covers in its algorithmic forecast in the Under 10 Dollars package. These stock picks are determined by screening our algorithm daily for noteworthy stocks selling for less than $10 per share. These forecasts are provided to our clients, which include 10 short-term and long-term time horizons, spanning from 3 days to 3 months.
Evaluation of the predictability indicator
We conduct our evaluation for the period from 1 April 2018 to 31 May 2019. Following the methodology as described in the previous sections, we start our analysis by computing the performance of the algorithm’s long and short signals for time horizons ranging from 3 days to 3 months, without first considering the signal indicator. We apply filtering by the predictability indicator for 3 different levels to investigate its sole marginal contribution in terms of return, and observe how returns change as these different filters are applied. Afterwards, we calculate the returns for the same time horizons for the benchmark using the stocks universe and compare it against the performance of the filtered sets of assets.
In our evaluation of the predictability indicator, the benchmark that is used is our internal benchmark, which is the returns we would have if we did not filter stocks by predictability, and merely purchased an equal amount of each stock in the Under 10 Dollars stocks universe. This is to determine the usefulness of filtering our results by our predictability indicator.
Our findings are summarized in the table below:
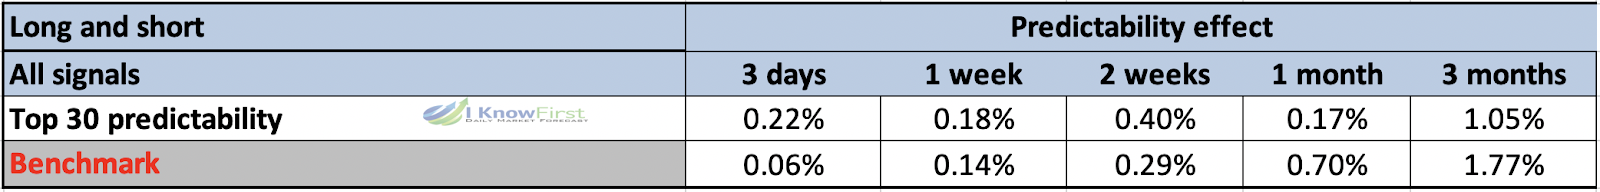
From the above table we can observe that generally the marginal predictability effect is stronger in the short term for this package. In the horizons of 3 days and 2 weeks, the predictability effect provided returns that were 4 times and nearly double the benchmark. However, in the long run, returns did not benefit in this case from a predictability filter.
In this section we will demonstrate how adding the signal indicator into consideration to our asset picking method improves the above performance even further. It is also important to measure the outperformance relative to the benchmark and for that we will apply the formula:

Therefore, we applied filtering by signal strength to the Top 30 assets filtered previously by predictability. The results of the testing showed that there is a significant positive marginal effect on the assets’ return, especially in the case of the short-term horizons. We present our findings in the following table and charts (Figure 6-2).


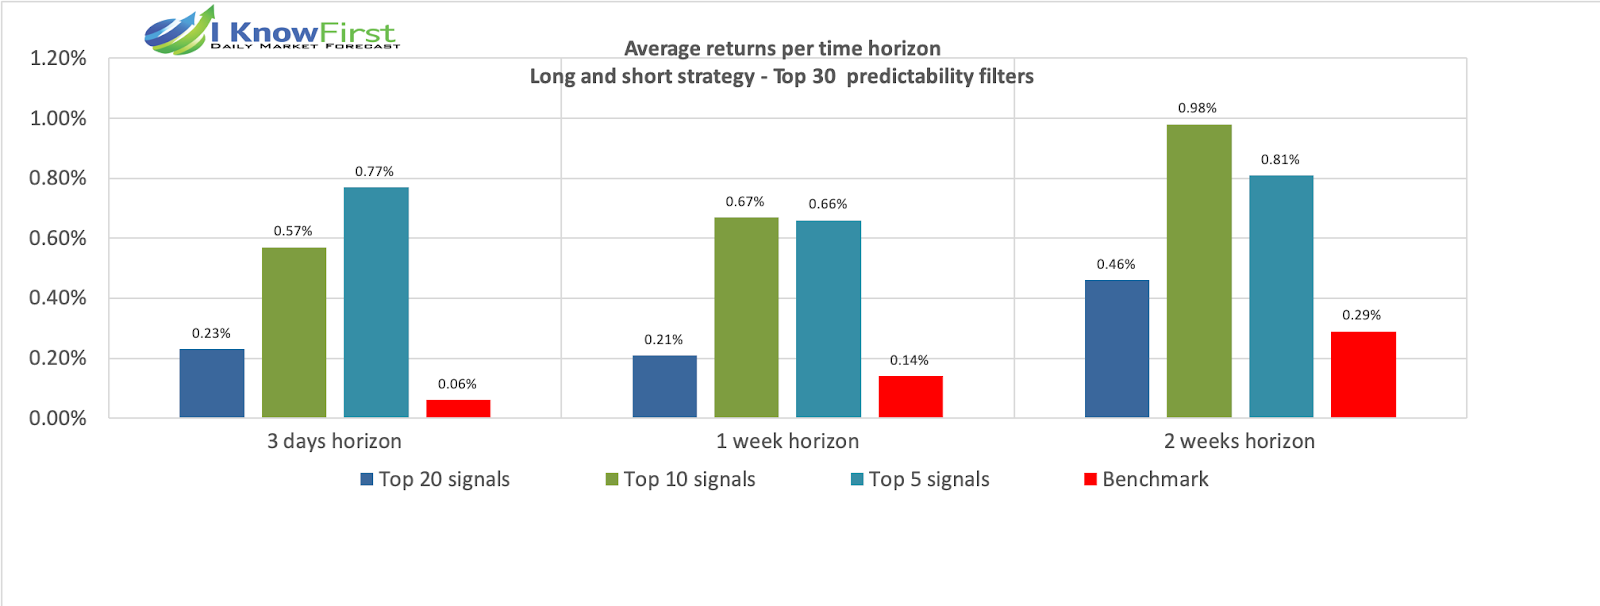

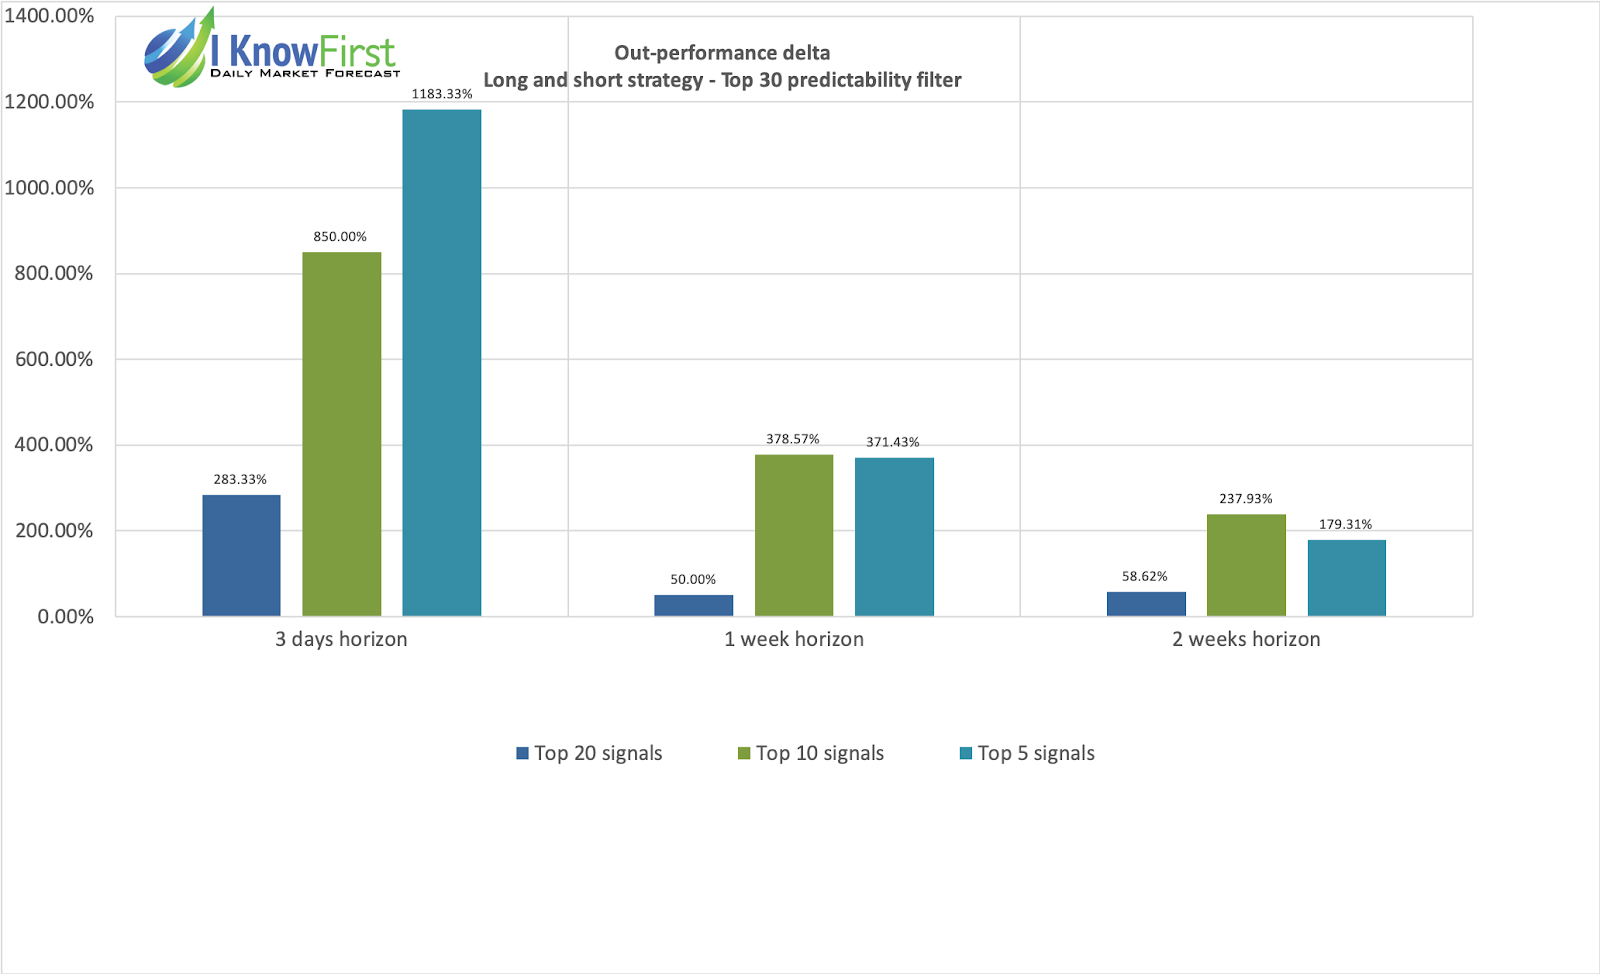
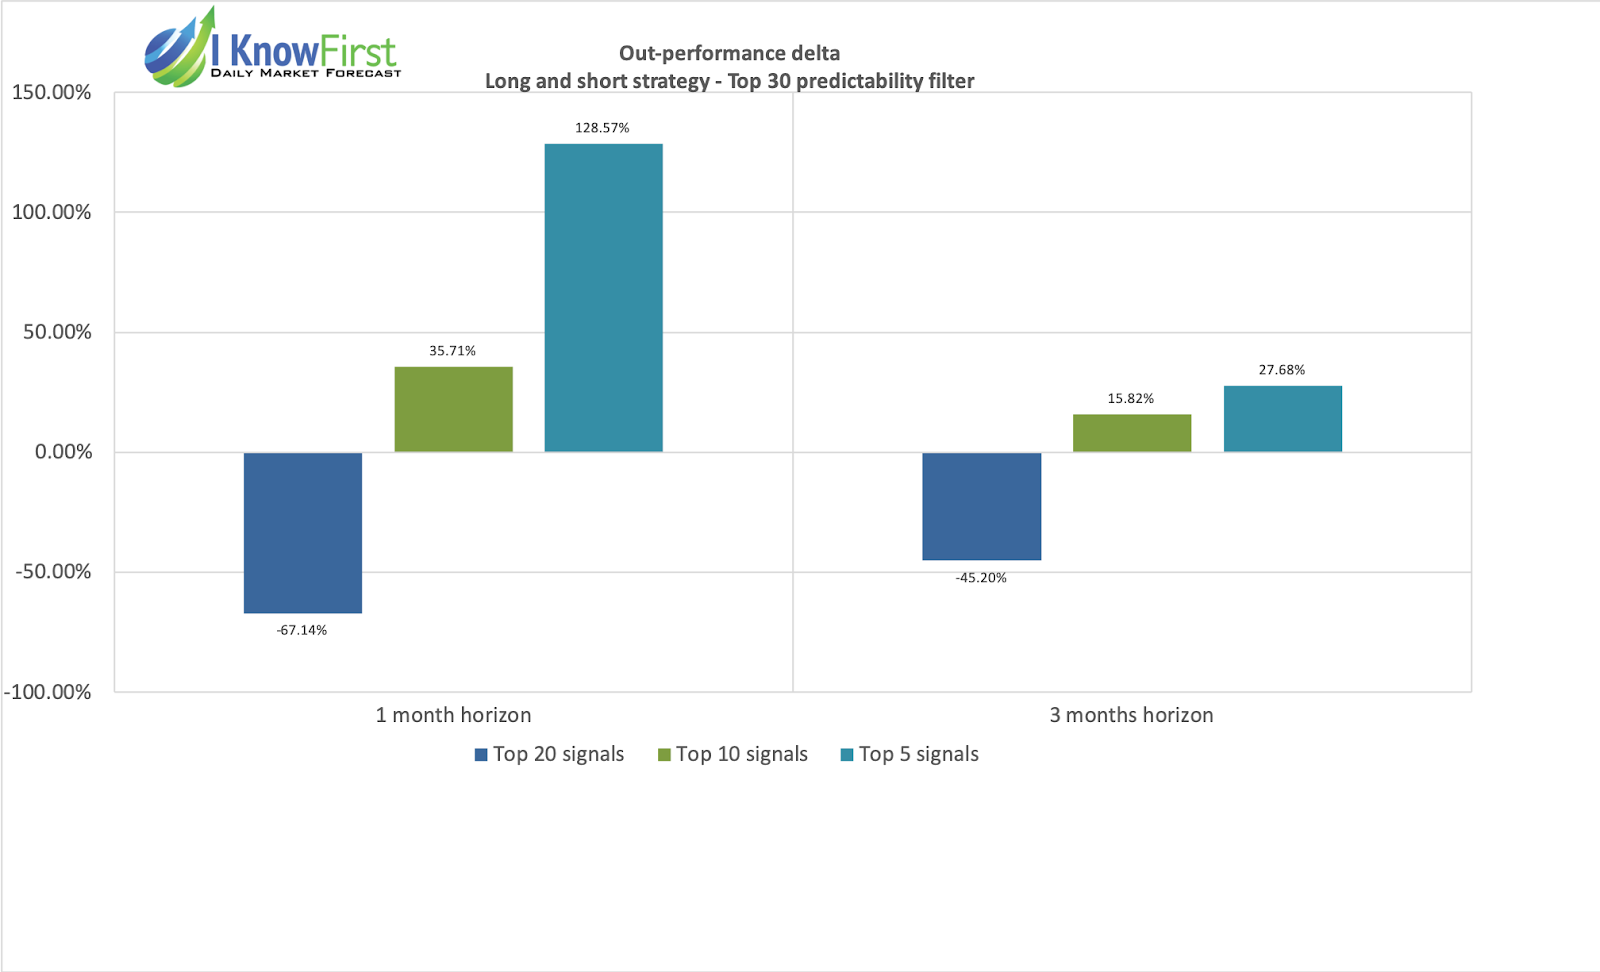

From the above set of charts, we can clearly see that if we apply signal strength filtering to the Under 10 Dollars universe, the subsets of Top 10 and Top 5 assets will start to produce greater returns than the benchmark with increase of time horizon. As soon as we start to consider longer time horizons, we see that the return of the Top 5 and Top 10 subset at 3-months’ period is significantly greater than Top 20, with Top 5 rendering 2.26% and Top 20 rendering 0.97%. At the same time, we observe that the returns of the Top 5 and Top 10 subsets for all the considered periods demonstrate increasing trend going above the benchmark’s results for all horizons. As a result, the highest outperformance over the considered benchmark was produced by Top 5 assets by signal with 1183.55% at 3-days time horizon. The hit ratios for this stock universe vacillated around the 50% mark. However, we can still witness trends that indicate the merit of the signal filters. We see that the hit ratio increases marginally as we filter stocks more selectively by signal, and that it also increases as we examine longer time horizons. For example, the Top 5 stocks display a hit ratio of 49% at the 3-days horizon, but 56% at the 3-month horizon. Likewise, the Top 20 stocks rendered a hit ratio of 51% at the 3-month horizon, whereas the Top 5 stocks rendered a 56% ratio for the same time range.
Conclusion
In this analysis, we demonstrated the out-performance of our forecasts for the stocks in the Under 10 Dollars universe picked by I Know First’s AI Algorithm during the period from April 1, 2018 to May 31, 2019. Based on the presented observations we record significant out-performance of the Top 5 and Top 10 stocks when our predictability and signal indicators are coupled to be used as an investment criterion. As shown in the above diagram, the Top 5 assets filtered by predictability and signal yield significantly higher returns than any other asset subset on all considered time horizons spanning from 3 days to 3 months. Therefore, an investor who wants to critically improve the structure of his investments into the Under 10 Dollars market within his or her portfolios can do so by simultaneously utilising the I Know First predictability and signal indicators as criteria for identifying the best performing stocks under $10.


