
I Know First Live forecast evaluation: Our Top S&P 500 Stocks Outperformed The Market from 2015 until 2018

Executive summary
As of August 8, 2018, I Know First finished a major performance evaluation of the live AI-based predictive forecasts for the top S&P 500 stocks sent to customers over the last three years. This evaluation clearly demonstrates the consistent out-performance of I Know First’s forecasts vs the S&P 500 index.
Evaluation period and universe
This evaluation spans from August 18, 2015 to August 6, 2018. This period was chosen since this was a major milestone in which I Know First introduced a major new version of the algorithm based on the S&P 500 investment universe. It includes analysis of all the predictions generated by the algorithm and sent daily to I Know First’s clients over this time period versus the S&P 500 index performance. The results of this study illustrate the significant positive effects of the algorithm’s continuous improvement utilizing advanced machine learning and AI capabilities.
Each daily forecast sent to I Know First’s clients includes predictions for the following time horizons: 3 days, 7 days, 14 days, 1 month, 3 month and 1 year.
The Basics Of ‘I Know First’ Algorithm – A Quick Reminder
I Know First’s algorithm provides two independent indicators for each asset – Signal and Predictability.
- The Signal is the predicted strength and direction of movement of the asset, measured from -infinity to +infinity.
- The predictability indicates our confidence in that result. It is a Pearson correlation coefficient between past algorithmic performance and actual market movement measured from -1 to 1.

You can find the detailed description of our heatmap here.
Our Stock Picking Method For the Top S&P 500 Stocks
Our stock picking method is very simple – we take X the most predictable top S&P 500 stocks from the set, and from them we take the top Y highest signals and pick them. This allows us to focus on the most predictable assets on the one hand, and the ones with the highest signal on the other.
Our Performance Evaluation Method
We perform long only evaluations on the individual stock level. We calculate what would be the return of each and every stock forecast we have issued in the analysis period (18/08/2015 – 06/08/2018). We then average those results.
Example
To evaluate the performance of our 1-month forecasts for the assets in the S&P 500 universe, we calculate the return of each trade by using this formula:
![]()
This is as if an investor purchased the asset based on our prediction and sold exactly 1 month in the future.
We calculate this for all trading days in the analysed time period and average the results.
Our Benchmark Method
The theory behind our benchmark method is the “Null hypothesis”, meaning buying every stock in the particular asset universe regardless of our ‘I Know First’ indicators.
In comparison, when using I Know First’s indicators, only when the signals are of high strength and high predictability, then the particular stocks should be bought.
The ratio of our signals trading results to benchmark results indicates the quality of the system and our indicators. For example: A benchmark for the 3 days horizon means buy on each day and sell exactly 3 business days afterwards. We then average the results to get the benchmark.
Performance Evaluations For Top S&P 500 Stocks Portfolio
In the following charts we present the proof that our predictability and signal indicators can be used to beat the benchmark and obtain alpha. We start by investigating the influence of the ‘I Know First’ signal indicator on the trade results. In the following chart you can see our out-performance of our Top 50 strategy compared to the S&P 500 index benchmark.
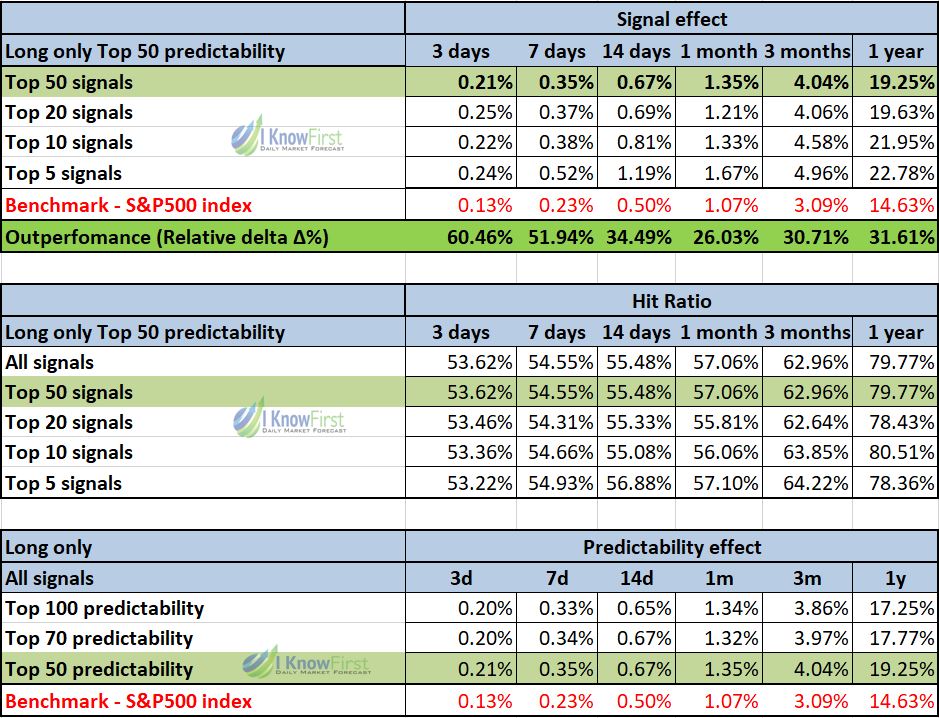
Figure 1. S&P 500 – Outperformance chart
The top table represents the results of the algorithms live forecast evaluation for top 50 stocks filtered by predictability criteria.
The results indicate clearly and consistently that the ‘I Know First’ AI-based forecasts beats the S&P 500 index’s return across all investment horizons, namely 3 days, 7 days, 14 days, 1 month, 3 month and 1 year, recording significant out-performance margins ranging from 26% to over 60%.
Moreover, when further narrowing down the ‘I Know First’ portfolio to the 10 top S&P 500 stocks, we see an additional significant improvement of the algorithm’s performance, across all time horizons exceeding 80% in margin improvement.


Figure 2. S&P 500 – Top 50 most predictable assets

Figure 3. I Know First’s Top 50 signals outperformance VS S&P500 index
As for the corresponding Hit Ratio values, the middle table shows us that it is significant for all investment horizons and reaches 80% for portfolios consisting out of 10 and 50 top S&P 500 stocks, showing the general increasing trend for longer prediction time frames.
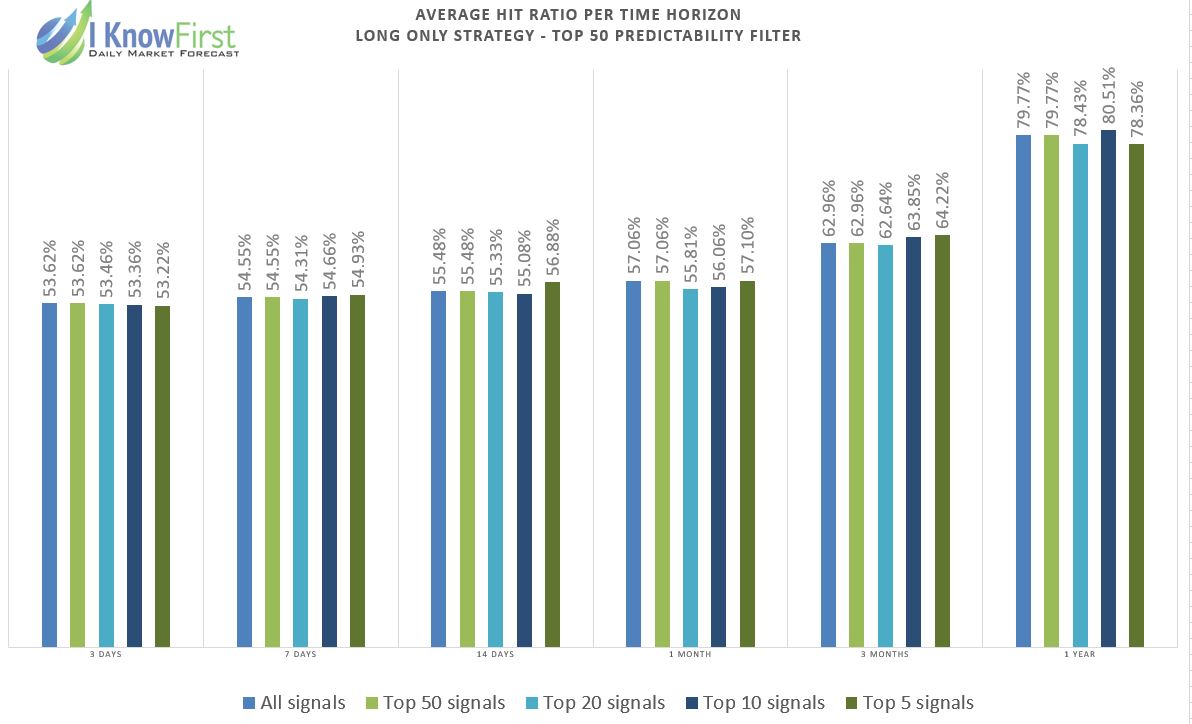
Figure 4. S&P 500 – Average hit ratio – Top 50 predictability filter
Conclusion
The goal of this analysis is to demonstrate the out-performance of the Top S&P 500 Stocks ‘I Know First’ picked from the S&P 500 investment universe over the S&P 500 index.
You can clearly see that for all the different time horizons, using ‘I Know First’s’ indicators to pick S&P 500 stocks greatly outperforms the index itself showing its outstanding effectiveness.


