
Sector Rotation Based Algorithmic Trading Strategies for Stocks and ETFs
In the following we present an analysis of Sector Rotation based Algorithmic Trading Strategies which rely upon quantitative equity sector predictions computed by aggregating our AI forecasting algorithm’s daily signals for S&P 500 stocks. We show that these aggregated predictions result in high performing trading strategies with:
- Sharpe ratios reaching 1.48
- Returns of up to 70.5% in a 2-year time period
- The possibility of trading up to 195 million US dollars
Algorithmic Sector Rotation Investment Strategies
Tactical Asset Allocation (TAA) attempts to improve a portfolio’s returns by catching near-term outperformance of specific asset classes. A specific form of TAA which seeks to determine which equity sectors will outperform the market in the short term and overweight those sectors in order to generate smart-beta is Sector Rotation. Of course, this type of strategy relies on a model able to successfully identify market conditions which result in the outperformance of specific sectors. I Know First’s self-learning algorithm is a perfect candidate for this type of prediction as it uses 15 years of historical data to identify recurring patterns in the stock market and generate daily market predictions for a set of over 7,000 assets.
In the following we aggregate the daily stock signals generated by our algorithm for S&P 500 stocks into algorithmic sector-level predictions for each of the 11 GICS sectors thus creating a daily sector ranking. We use this ranking to decide on the direction to trade both the corresponding Sector ETFs and the stocks within each sector and present the results of these backtests in the following article.
The results of these Sector Rotation strategies for the period 08/18/2015 – 05/05/2017 including the effect of bid-ask spreads and commissions (0.35 cents per share), are summarized in the following table (click on the table to enlarge). Rows 1 through 8 present the statistics of the I Know First Portfolios while row 9 shows those of the benchmark, the SPDR SPY ETF (market cap weighted S&P 500 stocks ETF).
Strategy Performance Table
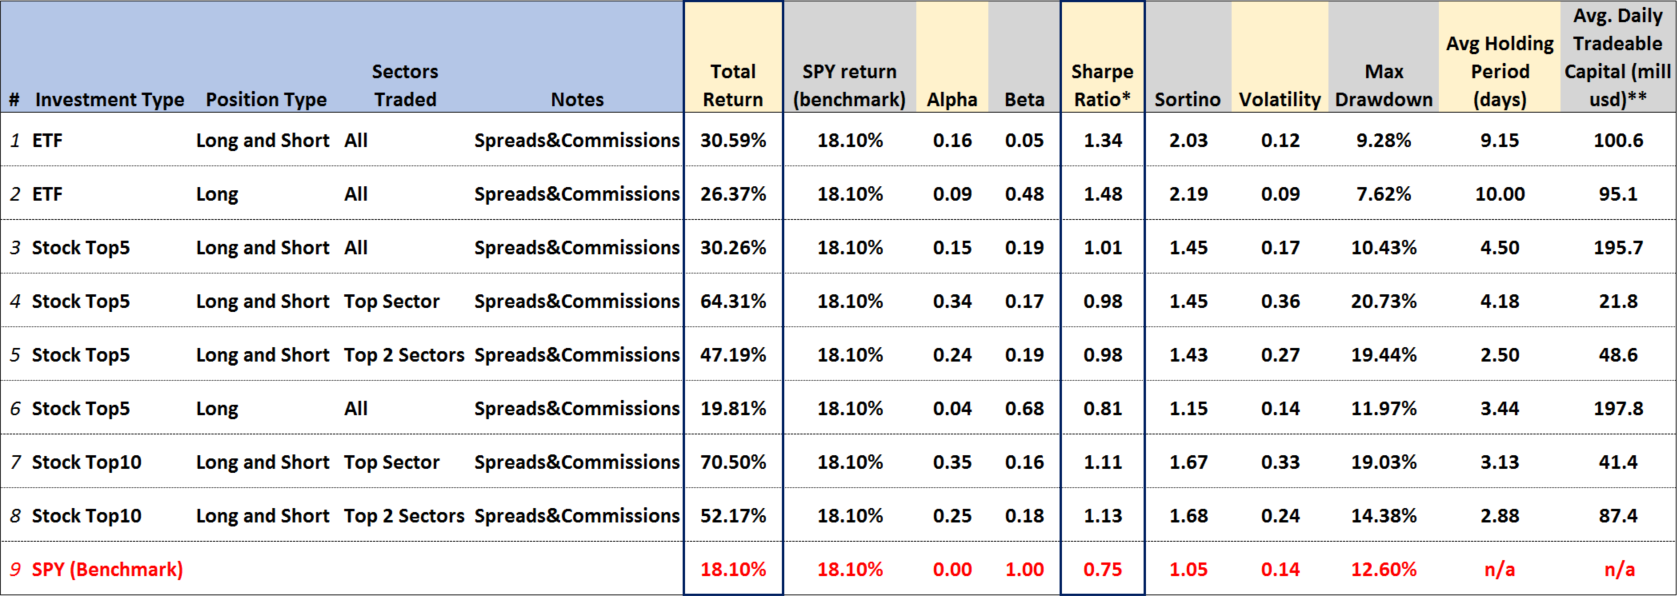
*Sharpe Ratio is a measure of the risk adjusted return of an investment. It is computed by dividing the return of the portfolio minus the risk-free rate by the standard deviation of the portfolio returns. The higher the ratio the more return the portfolio provides adjusted for its risk level.
**Avg. Daily Tradeable Capital is computed by averaging the daily sum of the dollar-volumes of the assets in the portfolio multiplied by 2.5%. It is a rough estimate of how much capital can be traded on a daily basis assuming we can trade 2.5% of each assets daily dollar volume.
Sector Based ETF Trading
Rows 1 and 2 in the table show the results of trading the SPDR Sector ETFs in the direction (long, short or neutral) determined by the algorithmic sector-level predictions. Row 1 shows the results when trading the ETFs both long and short while row 2 only invests in the ETFs for which the algorithm gives a long recommendation. Both strategies outperform the benchmark in terms of total return (30.59% and 26.37% versus 18.1%) while also presenting excellent risk adjusted returns (Sharpe ratios of 1.34 and 1.48) and significantly lower drawdown than the SPY (9.28% and 7.62% versus the SPYs 12.6%). Finally, note that these strategies require relatively less frequent rebalancing with average holding periods between 9 and 10 days and a rough estimate of how much capital can be invested considering liquidity limits gives over 95 million US dollars.
The performance lines of the two ETF strategies are shown in the following graph.
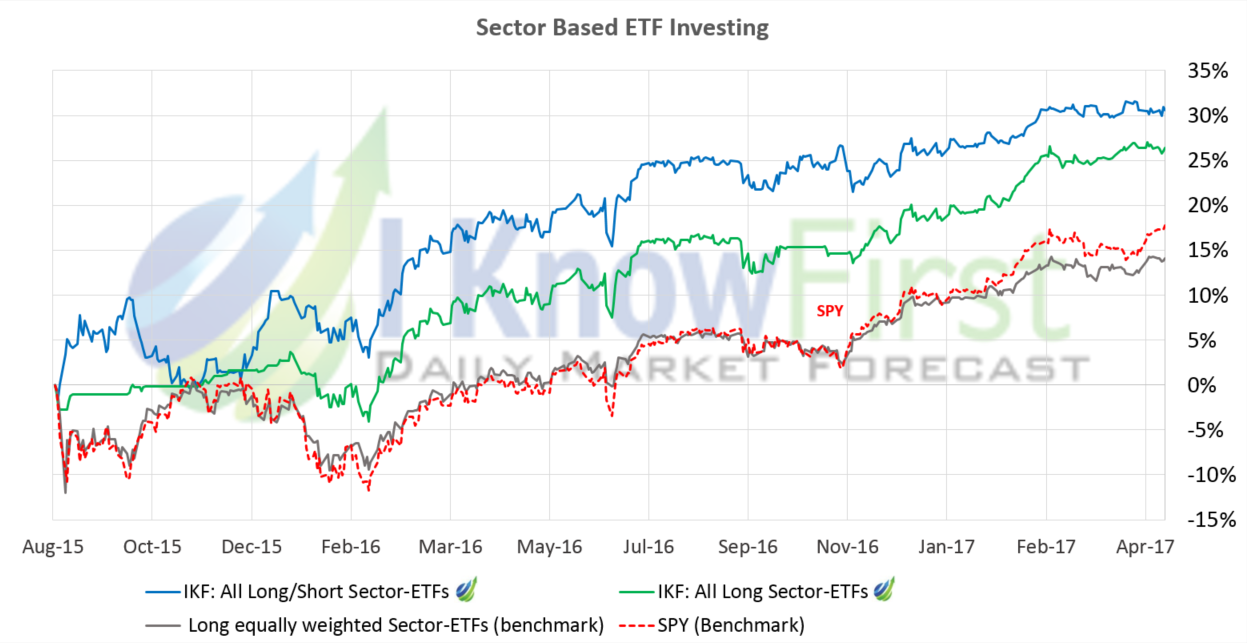
As can be seen above, both ETF strategies exhibit steady and stable growth over the benchmark, avoiding the market downturn in late 2015-early 2016 and presenting steady growth since February 2016. The consistency of the performance lines is thus well expressed in the high Sharpe ratios.
Sector Based Stock Trading
Rows 3 through 8 in the table present strategies in which, instead of the ETFs, we invest in the 5 or 10 stocks within each sector for which our forecasting algorithm gives the strongest signals in the same direction as the sector-level prediction. For example, if a sector on a given day receives a long prediction we invest in the stocks within that sector which have the strongest long signals. Rows 3 through 4 invest long and short in the strongest 5 stocks in each sector for all, the strongest and the strongest two sectors in terms of the aggregated sector predictions, while row 5 invests in the best 5 stocks from the best long sector. Finally, rows 7 and 8 invest long and short in the best 10 stocks in each sector for the best and best two sectors.
These strategies result in highly profitable portfolios, the best line (row 7) yielding a return of 70.5% in the analyzed time-period versus a return of 18.1% for the benchmark, with all Sharpe ratios clearly above the benchmark (see the Strategy Performance Table above).

Conclusion
In this article, we presented a first attempt at creating effective Sector Rotation trading strategies based on algorithmic sector-level forecasts computed by aggregating the respective stock-level predictions of our AI system.
ETF Trading Strategies
We show that trading Sector ETFs using these predictions results in portfolios that have strong returns (over 25% in the last 2 years versus the benchmark’s return of 18.1%), low risk (Sharpe ratios above 1.3 and drawdowns below 10%), relatively low rebalancing frequency (9 days), steady growth over the market, and the possibility of trading up to 100 million US dollars.
Stock Trading Strategies
The same concept applied to stocks results in high performing strategies (total returns up to 70%) with risk adjusted returns well above the SPY (Sharpe ratios above 0.8), and the possibility of trading up to 195 million US dollars.


