
Stock Options: AI Predictive Algorithm Reaches Accuracy Up To 85%
Executive Summary
In this stock market forecast evaluation report, we will examine the performance of the forecasts generated by the I Know First AI Algorithm for stock options for long and short positions that were sent daily to our customers. Our analysis covers the time period from August 22, 2019, until January 1, 2021.


Source: Yahoo Finance
Stock Options Evaluation Highlights:
- The most impressive outperformance of the S&P 500 Index is from the Top 5 signal group in the 1-year time horizon with more than 286% higher return.
- All the signal groups generated by I Know First succeeded in outperforming S&P 500 Index in the 90 days and 1-year time horizons.
- Every signal group has hit ratios are above 49% for all time horizons amid the COVID-19 crisis.
The above results were obtained based on forecasts’ evaluation over the specific time period using a consecutive filtering approach – by predictability, then by signal, to give an overview of the forecasting capabilities of the algorithm for the specific stock universe.
About the I Know First Algorithm
The I Know First self-learning algorithm analyzes, models, and predicts the stock market. The algorithm is based on Artificial Intelligence (AI) and Machine Learning (ML) and incorporates elements of Artificial Neural Networks and Genetic Algorithms.

The system outputs the predicted trend as a number, positive or negative, along with a wave chart that predicts how the waves will overlap the trend. This helps the trader to decide which direction to trade, at what point to enter the trade, and when to exit. Since the model is 100% empirical, the results are based only on factual data, thereby avoiding any biases or emotions that may accompany human derived assumptions.
The human factor is only involved in building the mathematical framework and providing the initial set of inputs and outputs to the system. The algorithm produces a forecast with a signal and a predictability indicator. The signal is the number in the middle of the box. The predictability is the number at the bottom of the box. At the top, a specific asset is identified. This format is consistent across all predictions.
Our algorithm provides two independent indicators for each asset – Signal and Predictability.
The Signal is the predicted strength and direction of the movement of the asset. Measured from -inf to +inf.
The predictability indicates our confidence in that result. It is a Pearson correlation coefficient between past algorithmic performance and actual market movement. Measured from -1 to 1.
You can find a detailed description of our heatmap here.
The Stock Market Forecast Performance Evaluation Method
We perform evaluations on the individual forecast level. It means that we calculate what would be the return of each forecast we have issued for each horizon in the testing period. Then, we take the average of those results by strategy and forecast horizon.
For example, to evaluate the performance of our 1-month forecasts, we calculate the return of each trade by using this formula:

This simulates a client purchasing the asset based on our prediction and selling it exactly 1 month in the future.
We iterate this calculation for all trading days in the analyzed period and average the results.
Note that this evaluation does not take a set portfolio and follow it. This is a different evaluation method at the individual forecast level.
The Hit Ratio Method
The hit ratio helps us to identify the accuracy of our algorithm’s predictions.
Using our Daily Forecast asset filtering, we predict the direction of the movement of different assets. Our predictions are then compared against actual movements of these assets within the same time horizon.
The hit ratio is then calculated as follows:

For instance, a 90% hit ratio for a predictability filter with a top 10 signal filter would imply that the algorithm correctly predicted the price movements of 9 out of 10 assets within this particular set of assets.
The Benchmarking Method – S&P 500 Index
In order to evaluate our algorithm’s performance in comparison to the US market, we used the S&P 500 index as a benchmark.
The S&P 500 measures the stock performance of the largest 500 companies by market cap listed on different stock exchanges in the United States. It is one of the most followed equity indices and is frequently used as the best indicator for the overall performance of US public companies, and the US market as a whole. S&P 500 is a capitalization-weighted index, the weight of each company in the index is determined based on its market cap divided by the aggregate market cap of all the S&P 500 companies.
For each time horizon, we compare the S&P 500 performance with the performance of our forecasts.
During the discussed period, the S&P 500 had a total rise of 31.33% despite a major fall in February-March 2020 due to the COVID-19 pandemic. However, losses were recovered and the S&P 500 rose above its prior value.
Stock Options Performance Evaluation – Overview
In recent weeks we saw the importance of stock options trading with the frenzy of buying call options on companies such as GME and AMC. The call buying was a part of an effort by individual investors organized via a Reddit forum to run up the prices of the heavily shorted companies, forcing short sellers to buy back their shares and accelerating the rally, creating a Short Squeeze. This strategy worked and at one point Gamestop shares gained 500% in a week jumping from 76$ to 469$.
In this report, we conduct testing for stock options that I Know First covers by its algorithmic forecast. The period for evaluation and testing is from August 22, 2019, until January 1, 2021. During this period, we were providing our clients with daily forecasts in time horizons spanning from 3 days to 1 year which we evaluate in this report.
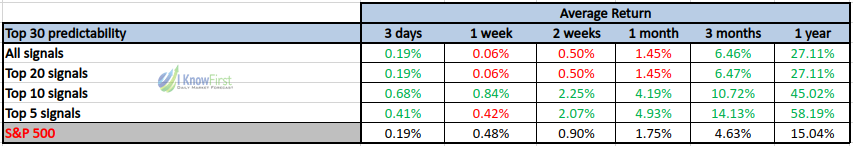
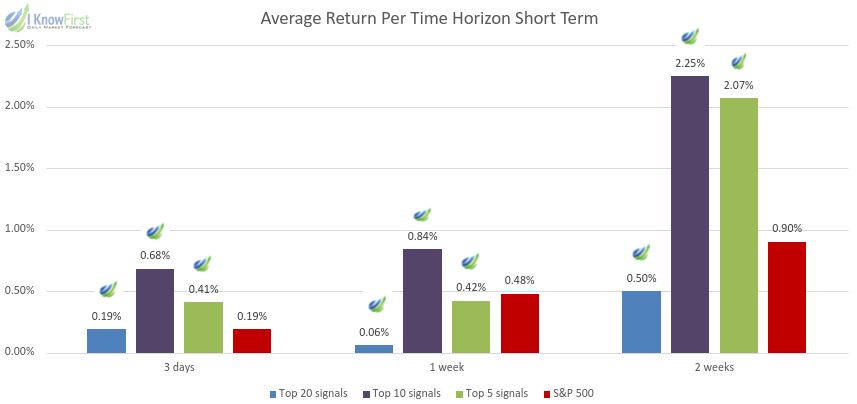
As can be seen in the table above, our algorithm provided positive returns for most time horizons. The S&P 500 benchmark was outperformed in many signal groups for most of the time horizons. In the one-year period, the top 5 signal group had 2.86 times higher return than the benchmark. The average return in most of the other time horizons for the top 5 signal group was outperforming by 115-220% than the S&P 500 index. We can also notice that the top 10 signal group outperformed the benchmark in every time horizon by at least 75% and up to 199%.

According to the table above, each signal group across every time horizon gave a hit ratio greater than 49%. This shows that the algorithm’s accuracy is consistent and reliable amid the COVID-19 crisis. For example, for the one-year time horizon, the Top 10 signal group had a hit ratio of 79% and the Top 5 signal group had a hit ratio of 85%. The average return for the 1-year time horizon outperformed the S&P 500 Index by a large margin, suggesting the consistent accuracy of the algorithm. The Top 20, Top 10, and Top 5 signal group for all time horizons all gave a hit ratio of 49-85% accuracy.
Conclusion
This stock options evaluation report presented the performance of I Know First’s algorithm from August 22, 2019, until January 1, 2021. It shows the average returns and hit ratios for all time horizons, with the algorithm outperforming the benchmark index in most of the time periods. The I Know First algorithm has obtained better performance on the 1-year time horizon. It is also important to note that every signal group across every time horizon gave a hit ratio are above 49% and up to 85%, showing a consistent and reliable accuracy.


