
Tesla Stock Predictions: I Know First Stock Forecasts Evaluation Report
Executive Summary
In this forecast evaluation report, we examine the performance of the Tesla stock forecast generated by the I Know First AI Algorithm for the TSLA stock with time horizons ranging from 3 days to 1 year, which were delivered daily to our clients. Our analysis covers the time period from 23 January 2019 to 19 March 2020. Below, we present our key takeaways for checking hit ratios of our TSLA predictions in the stock market.

Highlights:
- 100% Hit Ratio for a 1-year time period for Tesla stock forecast allowing our clients to be able to invest their money with significantly less risk
- Predictions consistently hit above 57% accuracy despite volatile market conditions
Note that the above results were obtained as a result of an evaluation conducted over the specific time period to give a presentation for the TSLA movements. The following report provides an extensive explanation of our methodology and a detailed analysis of the performance metrics that we obtained during the evaluation. This report is a new I Know First evaluation series illustrating the ability to provide successful forecasting on TSLA.
About the I Know First Algorithm

The I Know First self-learning algorithm analyses, models, and provides stock market predictions for the capital markets, including stocks, bonds, currencies, commodities and interest rates. The algorithm is based on Artificial Intelligence (AI) and Machine Learning (ML) and incorporates elements of Artificial Neural Networks and Genetic Algorithms.
The system outputs the predicted trend as a number, positive or negative, along with a wave chart that predicts how the waves will overlap with the predicted trend. Consequently, the trader can decide which direction to trade, when to enter the trade, and when to exit the trade. The model is 100% empirical, based only on factual data, thereby avoiding any biases or emotions that may accompany human assumptions. I Know First’s model only involves the human factor in building the mathematical framework and providing the initial set of inputs and outputs to the system. The algorithm produces a forecast with a signal and a predictability indicator. The signal is the number in the middle of the box. The predictability is the number at the bottom of the box. At the top, a specific asset is identified. This format is consistent across all predictions.
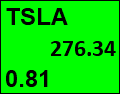
Our algorithm provides two independent indicators for the index – signal, and predictability.
The signal is the predicted strength and direction of the movement of the index. This is measured from –inf to +inf.
The predictability indicates our confidence in the signal. The predictability is a Pearson correlation coefficient relating to past algorithmic performance and actual market movement, measured from -1 to 1. You can find a detailed description of our heatmap here
The Hit Ratio Calculation
The hit ratio helps us to identify the accuracy of our algorithm’s predictions.
We predict the direction of the movement of TSLA using our algorithm. Our predictions are then compared against actual movements of TSLA within the same time horizon.
The hit ratio is then calculated as follows:

Stock in Spotlight: Tesla Stock Predictions
Tesla, Inc. is an American electric vehicle and clean energy company based in Palo Alto, California. It was founded by Martin Eberhard and Marc Tarpenning, and joined by Elon Musk, J. B. Straubel, and Ian Wright one year later. It is considered the best plug-in as well as the best-selling battery electric passenger car manufacturer. TSLA is listed on the NASDAQ.
Tesla Stock Price Movements

From 23 January 2019 to 19 March 2020, the Tesla stock price has fluctuated. Despite a general uptrend from October to February, the stock fell in price over March. It is imperative for traders to spot such changes in prices to profit during volatile times in the stock market.
Evaluating Tesla Stock Predictions Hit Ratio

Through the results above, you can see that we at I Know First have developed an algorithm that can consistently predict TSLA stock movements throughout various time periods. On average, I Know First has achieved the incredible feat of hitting TSLA exact movement 100% of the time for the 1-year prediction time horizon. This, in essence, means that the algorithm was correct all the time on the 1-year time horizon, allowing our clients to make the safest investments. Additionally to that, we can also predict the 3-day time horizon, 7-day time horizon, 14-day time horizon, one-month time horizon, and 3-months time horizon at 57%, 60%, 61%, 68%, and 58% accuracy respectively. This allows our investors to have a safer outlook when investing despite these quick and volatile time periods.
Conclusion
All in all, we at I Know First have a mission to provide our clients with the most robust and reliable stock market forecasts. By sharpening our ability to predict TSLA using our artificial intelligence system, we provide our clients with increasing certainty that their investment will be safer and more profitable. Within the bounds of certainty, we have consistently been able to find that we can predict the TSLA movements above 57% of the time over the last 15 months. The peak of that is the 100% hit ratio over the 1-year time horizon, meaning our predictions for Tesla stock price movement were correct all the time on average for long term investments.


