
Top ETFs: AI Outperforms S&P 500 by 28.80%
Executive Summary
The purpose of this Top ETFs forecast report is to present the results of the live forecast performance evaluation for the Top ETFs by the I Know First AI Algorithm. The following results were observed when a signal filter was applied. The evaluation period is from 1st November 2020 to 28th February 2022. The corresponding returns distribution of stock signal filters for this package is shown below:


The Top ETFs Report Highlights:
- The highest average return is 52.32% for the Top 5 Signals on a 1-year time horizon
- The most impressive out-performance against the S&P 500 index is from the Top 5 signal group in the 7-day horizon with 2.79 times higher return
- Predictions reach up to 90% hit ratio regardless of economic conditions
- Every signal group has hit ratios above 57% for all time horizons
- I Know First provides an investment strategy for institutional investors that generated a return of 99.83% and exceeded the S&P 500 return by 67.70% for the analyzed period
About the I Know First Algorithm
The I Know First self-learning algorithm analyzes, models, and predicts the stock market. The algorithm is based on Artificial Intelligence (AI) and Machine Learning (ML) and incorporates elements of Artificial Neural Networks and Genetic Algorithms.
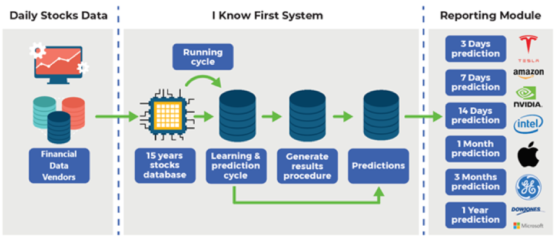
The system outputs the predicted trend as a number, positive or negative, along with a wave chart that predicts how the waves will overlap the trend. This helps the trader to decide which direction to trade, at what point to enter the trade, and when to exit. Since the model is 100% empirical, the results are based only on factual data, thereby avoiding any biases or emotions that may accompany human-derived assumptions.
The human factor is only involved in building the mathematical framework and providing the initial set of inputs and outputs to the system. The algorithm produces a forecast with a signal and a predictability indicator. The signal is the number in the middle of the box. The predictability is the number at the bottom of the box. At the top, a specific asset is identified. This format is consistent across all predictions.
Our algorithm provides two independent indicators for each asset – Signal and Predictability.
The Signal is the predicted strength and direction of the movement of the asset. Measured from -inf to +inf.
The predictability indicates our confidence in that result. It is a Pearson correlation coefficient between past algorithmic performance and actual market movement. Measured from -1 to 1.
You can find a detailed description of our heatmap here.
The Stock Market Forecast Performance Evaluation Method
We perform evaluations on the individual forecast level. It means that we calculate what would be the return of each forecast we have issued for each horizon in the testing period. Then, we take the average of those results by strategy and forecast horizon.
For example, to evaluate the performance of our 1-month forecasts, we calculate the return of each trade by using this formula:
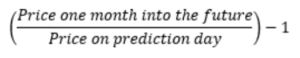
This simulates a client purchasing the asset based on our prediction and selling it exactly 1 month in the future.
We iterate this calculation for all trading days in the analyzed period and average the results.
Note that this evaluation does not take a set portfolio and follow it. This is a different evaluation method at the individual forecast level.
The Hit Ratio Method
The hit ratio helps us to identify the accuracy of our algorithm’s predictions.
Using our Daily Forecast asset filtering, we predict the direction of the movement of different assets. Our predictions are then compared against the actual movements of these assets within the same time horizon.
The hit ratio is then calculated as follows:

For instance, a 90% hit ratio for a predictability filter with a top 10 signal filter would imply that the algorithm correctly predicted the price movements of 9 out of 10 assets within this particular set of assets.
The Benchmarking Method – S&P 500 Index
In order to evaluate our algorithm’s performance in comparison to the US market, we used the S&P 500 index as a benchmark.
The S&P 500 measures the stock performance of the largest 500 companies by market cap listed on different stock exchanges in the United States. It is one of the most followed equity indices and is frequently used as the best indicator for the overall performance of US public companies, and the US market as a whole. The S&P 500 is a capitalization-weighted index, the weight of each company in the index is determined based on its market cap divided by the aggregate market cap of all the S&P 500 companies.
For each time horizon, we compare the S&P 500 performance with the performance of our forecasts.
Top ETFs Performance Evaluation – Overview
In this top ETFs report, we conduct testing for ETF stocks that I Know First covers by its algorithmic forecast. The period for evaluation and testing is from November 1st, 2020 to February 28th, 2022. During this period, we were providing our clients with daily top ETFs forecasts in time horizons spanning from 3 days to 1 year which we evaluate in this report.
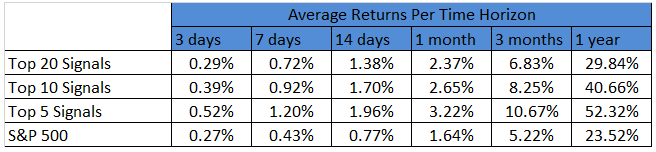
As can be seen in the table above, our algorithm provided positive returns for most of the time horizons. The S&P 500 benchmark was outperformed in the most signal groups for most of the time horizons. We see that we get the highest return for the Top 5 Signals group for all horizons.
From the above charts, it is evident that as the forecasting horizon expands, the average returns tend to become higher. For the 7-day time horizon, the Top 5 Signals group significantly outperformed the benchmark index – by more than 2.79 times resulting in an average return of 1.20% versus the S&P 500’s average return of 0.43%. Ultimately, the I Know First algorithm shows the highest average return for the 1-year forecast as 52.32% for the Top 5 Signals which exceeds the S&P 500 index by 28.80%. In the 14-day period, the AI Algorithm was able to generate the highest return of 1.96% for the Top 5 Signals which exceeds the S&P 500 index by 0.77%.

According to the table above, all the signal groups across all time horizons gave a hit ratio greater than 57%. It should be noted that as the time horizon gets longer, I Know First hit ratios gradually increase from the 58% ratio interval for the short-term horizons to 90% at the Top 5 Signals subset for the 1-year horizon. All across the board, as the time horizon gets longer the hit ratio increases for the Top 20 by 27%, Top 10 by 31%, and 5 Signals by 32%. Examining Table 2 shows that a hit ratio for the Top 5 Signals is associated with a high average return, and as the forecast range expands, the return increases in performance.

Looking at Figure 3, it is clear that at the short term horizons the hit ratios are relatively low at all signal indicators but the hit ratios increase over the long term horizons showing the I Know First Algorithm is able to successfully predict most of the stock movements.
I Know First has used algorithmic outputs from the ETF package to provide an investment strategy for institutional investors.

The investment strategy that was recommended to institutional investors by I Know First accumulated a return of 99.83% that exceeded the S&P 500 return by 67.70%.
Top ETFs: Conclusion
This top ETFs report looked at the live performance forecast of I Know First data for the ETF Package from November 1st, 2020 to February 28th, 2022. From the above data, we can observe that the I Know First Algorithm is exceeding the S&P 500 benchmark index across all signal filtering subsets and forecasting periods in most groups. Data from Figures 1 and 2 above shows I Know First was able to generate a return that exceeded the S&P 500 return by 28.80% in one year. In the 14-day period, the Top 5 Signal index is 1.96% that exceeds the S&P500 index by 1.19%. Moreover, I Know First has used AI outputs to provide an investment strategy for institutional investors that generated a return of 99.83% and exceeded the S&P 500 return by 67.70% for the analyzed period.


