
Stock Forecast Evaluation Report For US Stock Market – Significantly Beating S&P 500 Index


Executive Summary
In this stock forecast evaluation report, we will examine the performance of the forecasts generated by the I Know First AI Algorithm for the US stock market and sent to our customers on a daily basis. Our analysis covers time period from January 1, 2019 to May 23, 2019.
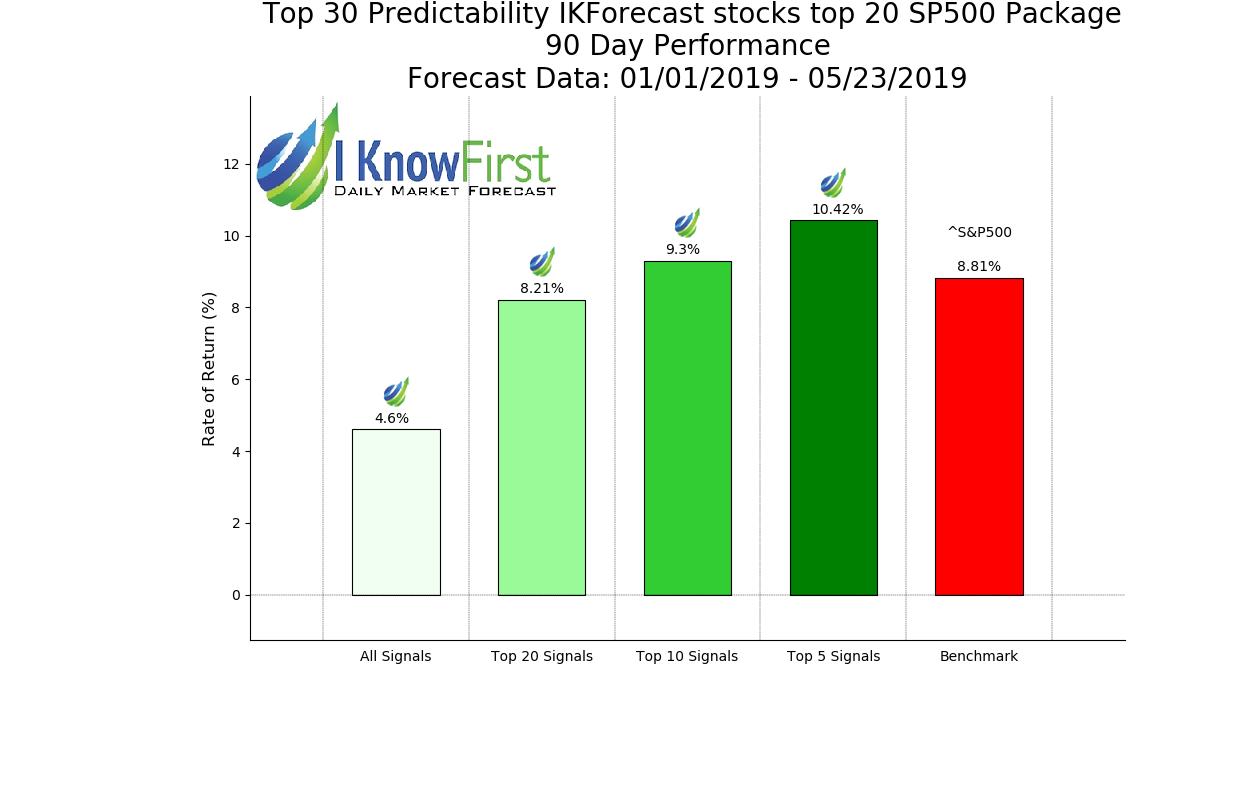
- Top 5 signals provided the most predictable stocks with a return of 10.42% in a 3-month investment horizon, beating the benchmark by 1.61%.
- There is a clear correlation between increasing time horizons and investment return.
- The benchmark was over-performed in the top 10 and 5 signal classes.
The above results were obtained based on the stock forecast evaluation over the specific time period using consecutive filtering approach – by predictability, then by signal, to give general overview of the forecasting capabilities of the algorithm for specific stock universe. The following sections of this study will develop the analysis and the data behind the above results and provide you with deeper understanding of the Methodology and the filtering results for different subsets of assets.
We will start with an introduction to our stock picking and bench-marking methods and then apply it to the stock universe of the S&P 500 index as well as all of the stocks covered by us in the “S&P 500 Companies” Package. This stock forecast evaluation is part of our continuous studies of live I Know First’s AI predictive algorithm performance.
About the I Know First Algorithm

The I Know First self-learning algorithm analyzes, models, and predicts the capital market, including stocks, bonds, currencies, commodities and interest rates markets. The algorithm is based on Artificial Intelligence (AI) and Machine Learning (ML), and incorporates elements of Artificial Neural Networks and Genetic Algorithms.
The system outputs the predicted trend as a number, positive or negative, along with a wave chart that predicts how the waves will overlap the trend. This helps the trader to decide which direction to trade, at what point to enter the trade, and when to exit. Since the model is 100% empirical, the results are based only on factual data, thereby avoiding any biases or emotions that may accompany human derived assumptions. The human factor is only involved in building the mathematical framework and providing the initial set of inputs and outputs to the system. The algorithm produces a forecast with a signal and a predictability indicator. The signal is the number in the middle of the box. The predictability is the number at the bottom of the box. At the top, a specific asset is identified. This format is consistent across all predictions.
Our algorithm provides two independent indicators for each asset – signal and predictability. The signal is the predicted strength and direction of movement of the asset. This is measured from -inf to +inf. The predictability indicates our confidence in that result. It is a Pearson correlation coefficient between past algorithmic performance and actual market movement. This is measured from -1 to 1.
You can find a detailed description of our heatmap here.
The Stock Picking Method
The method in this evaluation is as follows:
We take the top X most predictable assets, and from them we pick the top Y highest signals.
By doing so we focus on the most predictable assets on the one hand, while capturing the ones with the highest signal on the other.
For example, a top 30 predictability filter with a top 10 signal filter means that on each day we take only the 30 most predictable assets, and then we pick from them the top 10 assets with the highest absolute signals.
We use absolute signals since these strategies are long and short ones. If the signal is positive, then we buy and, if negative, we short.
The Performance Evaluation Method
We perform a stock forecast evaluation on the individual forecast level. This means that we calculate the return of each forecast we have issued for each horizon in the testing period. We then take the average of those results by strategy and forecast horizon.
For example, to evaluate the performance of our 1-month forecasts, we calculate the return of each trade by using this formula:
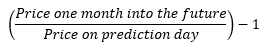
This simulates a client purchasing the asset on the day we issue our prediction and selling it exactly 1 month in the future from that day.
We iterate this calculation for all trading days in the analyzed period and average the results.
Note that this stock forecast evaluation does not take a set portfolio and follow it. This is a different stock forecast evaluation method at the individual forecast level.
The Hit Ratio Method
The hit ratio helps us to identify the accuracy of our algorithm’s predictions.
Using our asset filtering method based on predictability and signal, we predict the direction of movement of different assets. Our predictions are then compared against actual movements of these assets within the same time horizon.
The hit ratio is then calculated as follows:

For instance, a 90% hit ratio for a top 30 predictability filter with a top 10 signal filter would imply that the algorithm correctly predicted the price movements of 9 out of 10 assets within this particular set of assets.
The Benchmarking Method
We utilise two benchmarks to determine the effectiveness of our methodology. An internal benchmark is used to determine the effectiveness of filtering assets based solely on predictability. The S&P 500 index is used as a benchmark only after filtering assets based on predictability and signal.
In the first case, the theory behind this benchmarking method is the “Null hypothesis“. This means buying every asset in the particular asset universe regardless of our I Know First indicators. For instance, if we were to identify the top 20 assets from stock universe of 50 stocks, we would calculate the rate of return of 50 stocks, where an equal amount of each stock would be bought at the start of the time horizon and sold at the end of the time horizon. This helps us to determine the effectiveness of our predictability-based asset filtering process by comparing the rate of returns of the benchmark with the rate of return of our predictability-based strategy.
In the second case, particular stocks should be bought (or shorted) when they have been identified to have high signal strength and high predictability. We compare our rate of return based on purchasing (or shorting) the top X assets after applying both the predictability and signal filters with the rate of return of the S&P 500 index in the same time horizon. This helps us to determine the effectiveness of our methodology against the average investor’s returns.
The ratio of our trading results (based on our indicators) to benchmark results indicates the quality of the system and our indicators.
Example: A benchmark for the 3 days horizon means buy on each day and sell exactly 3 business days afterwards. We then average the results to get the benchmark. This is to conduct an apples to apples comparison.
Performance Evaluation: Evaluating The Predictability Indicator
We conduct our research for the period from 1 Jan 2019 to 23 May 2019. Following the methodology as described in the previous sections, we start our analysis by computing the performance of the algorithm’s signals for time horizons ranging from 3 days to 3 months, without first considering the signal indicator. We applied filtering by the predictability indicator for several different levels to investigate its sole marginal contribution in terms of return.
Performance Evaluation: Evaluating The Signal Indicator
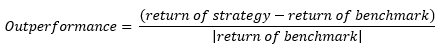
After filtering by predictability, we added the signal indicator to our asset picking method to improve the above performance even further. It is important to measure the performance of our strategy with respect to the benchmark, and for that we will apply the formula:
We further filter and rank the assets based on absolute signal strength to the Top 30 assets, which were previously already filtered by predictability.
In this article, we examine the kind of effect the signal filter does. To do so, we have filtered the stocks by predictability, selected the 30 most predictable stocks to analyze among the 500 stocks in the S&P 500 stock universe based on I Know First’s algorithm. The stocks are not necessarily all long or short positions, but they are a mix of both. That is because the I Know First algorithm believes in getting a good return for both bull and bear markets.
S&P 500 – Key Performance Indicators Summary


Stocks which are filtered by predictability represents a very good option for investors who are keen on highly probable stocks to either go long on it or short on it. The stocks in the table above have been filtered by predictability. We would like to further explore the effect of adding another filter above it, in the form of the strength of the signal. This is especially popular with investors, as these stocks promises to deliver great returns. In this article, we will demonstrate how adding the signal indicator to our stock picking method improves performance.
Therefore, we applied filtering by signal strength to the Top 30 assets filtered by predictability. The results of the testing showed that there is a significant positive marginal effect on the assets return, especially in the cases of longer investment horizons of 1 month and 3 months. We present our findings in the following table and charts.
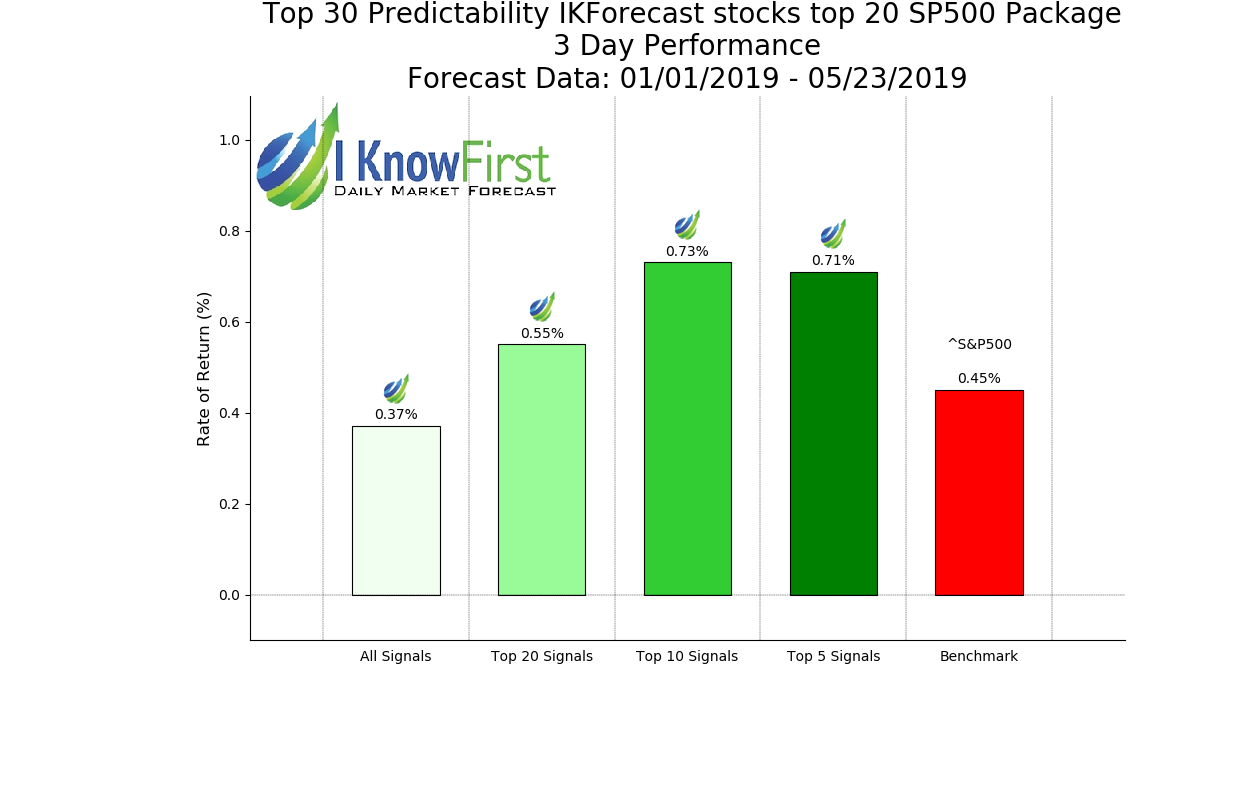
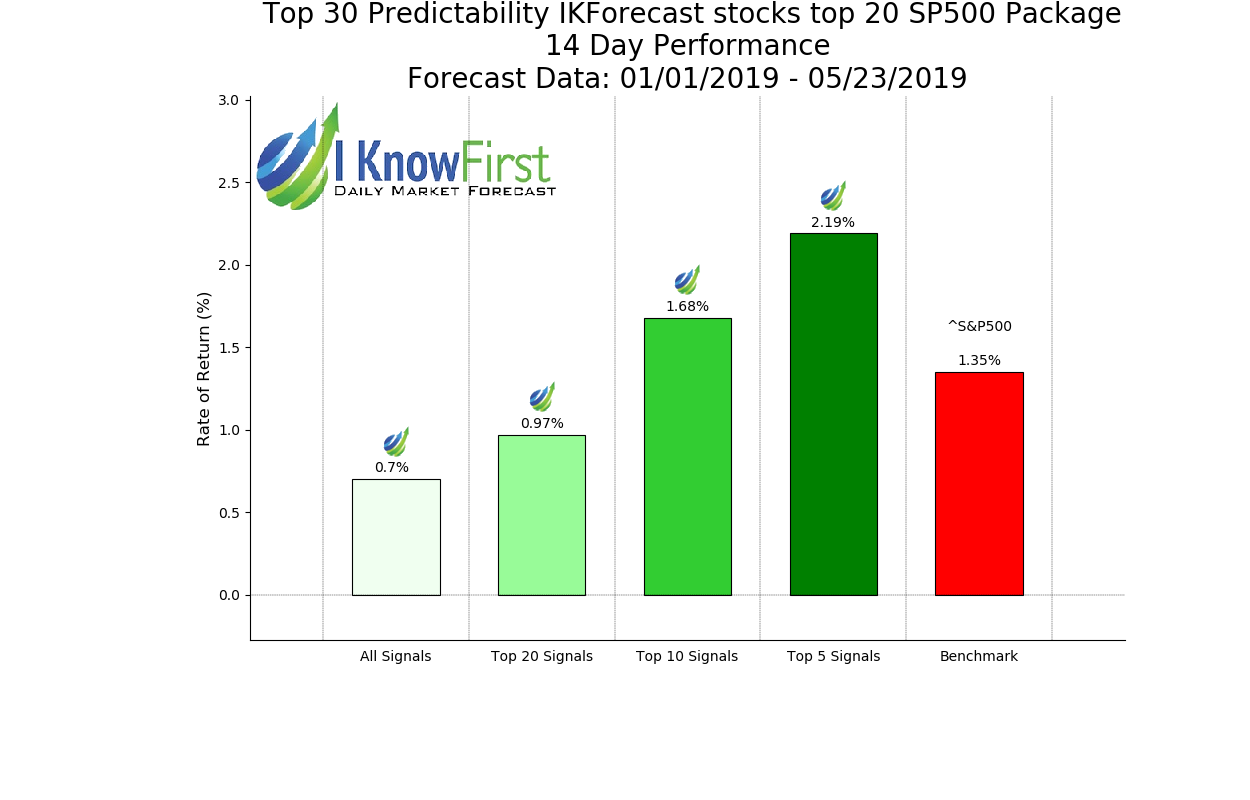
From the above set of charts, after applying the signal strength filtering to the S&P 500 stocks universe, the subsets of Top 10 and Top 5 stocks will start to produce greater returns than the benchmarks for all time horizons of 3 days, 7 days, 14 days, a month and 3 months. When we consider 3-month time horizons, returns of the Top 20, Top 10 and Top 5 subsets make significant jump to 8.21%, 9.3% and 10.42% returns respectively, as compared to the shorter periods. However, it is worth noting that the Benchmark outperforms the Top 20 Signal of a time horizon of 2 weeks with returns of 1.24%.
Hit ratios are important for the investor using I Know First’s proprietary AI algorithm. The investor is interested in understanding how an unadulterated portfolio would compare against one that uses the algorithm. If the hit ratio is 50%, it is merely as good as the flip of a fair coin. Not just any number above 50% is good enough for the layman investor. 60% is probably the fair minimum hit ratio that the investor can accept. The Hit Ratios shown above includes the Top 20, Top 10 and Top 5 Signals with horizons of 3 days, 7 days, 14 days, a month and 3 months. If one takes a closer look, the hit ratios improve as the investment horizon expands. The time horizon commensurates with the hit ratio, which explains why the Top 5 Signal has a Hit Ratio of 72% for a 3 month time horizon which is by far, better than many forecasts.
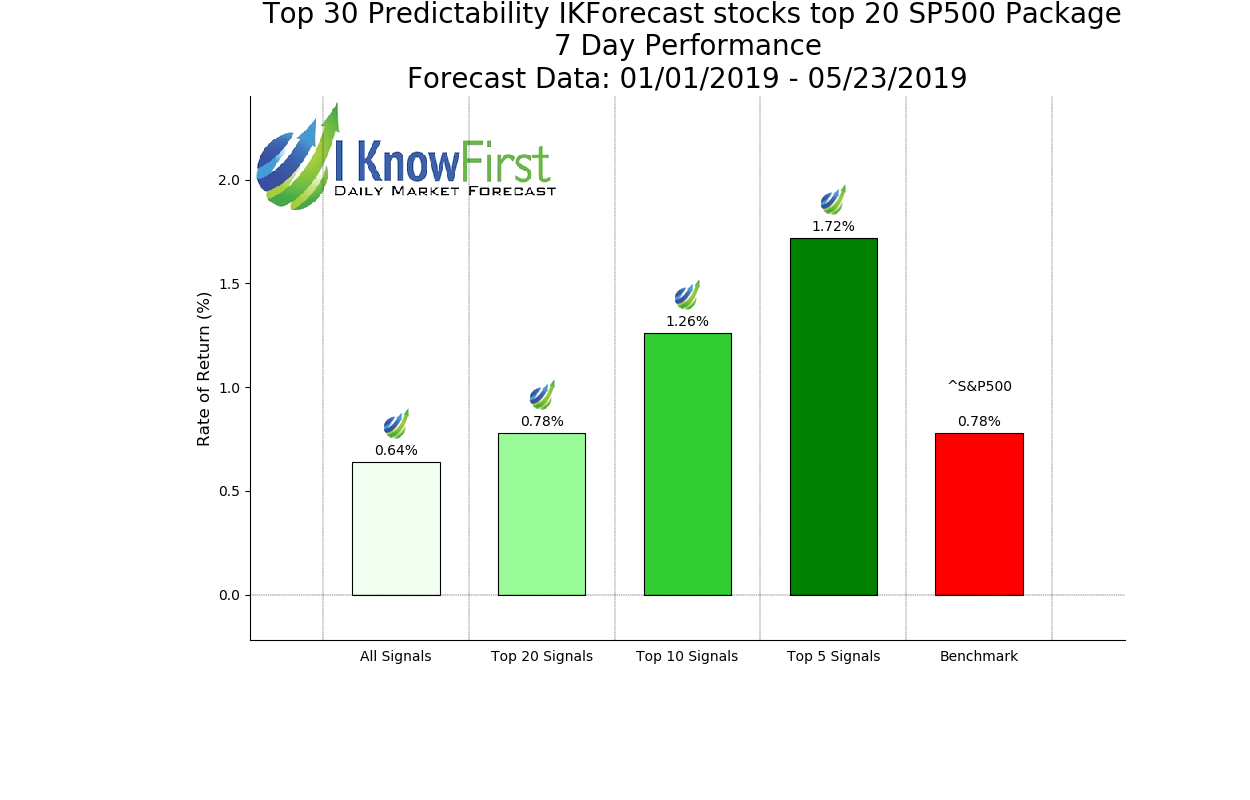
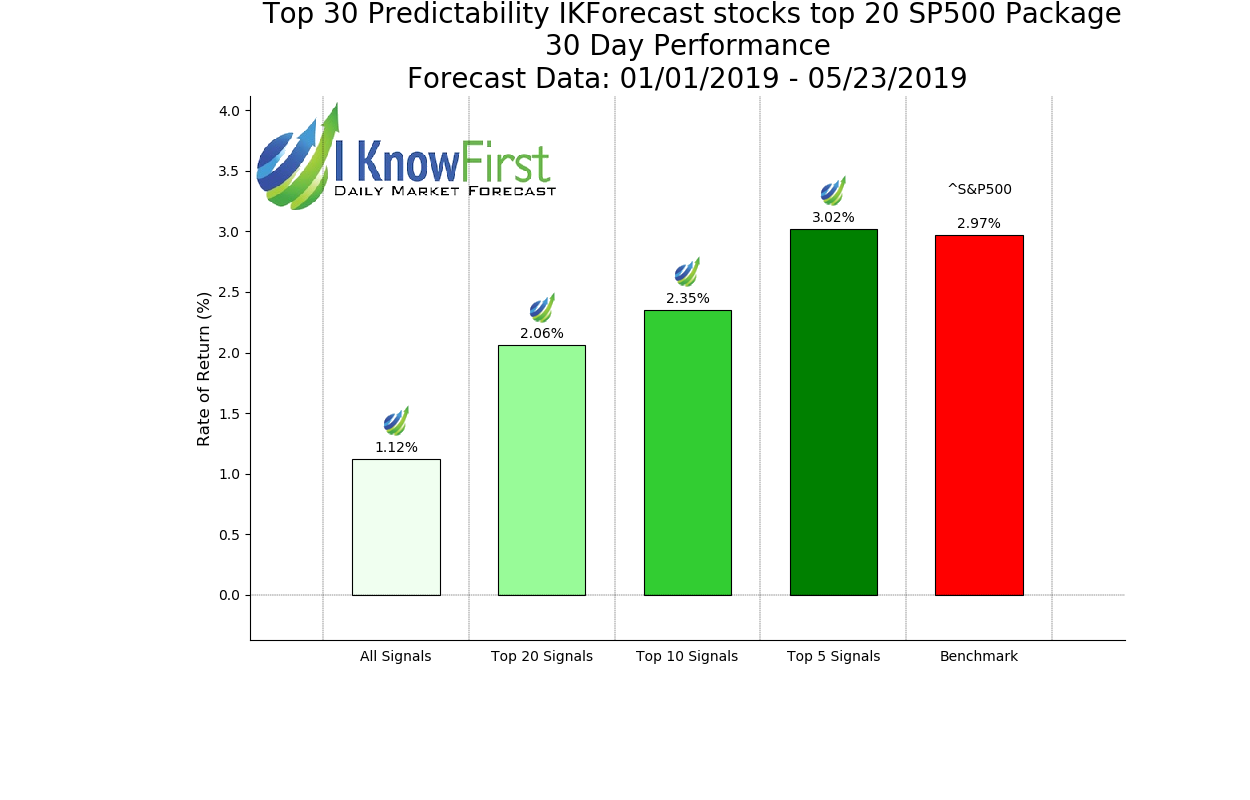
From the above set of charts, when we applied signal strength filtering to the S&P 500 stocks universe, the subsets of Top 10 and Top 5 stocks matched or produced greater returns than the S&P 500 with increase of time horizon. For the time horizon of 3 days, I Know First forecasts outperformed the S&P 500 by a mile. The Top 10 signals produced returns of 0.73%, much higher than the 0.45% returns that the S&P 500 posted. It also outperformed the Top 20 and Top 5 signals. This may be attributed to the difference in predictability of stocks. Another interesting thing that we see, when the time horizon becomes a week, is that there is no difference between the unfiltered stocks, Top 20 and the S&P 500, with returns of 0.78%. As one might predict, our forecasts of the Top 10 and Top 5 signals performed better than the S&P 500 over a week, returning 1.26% and 01.72% respectively. The key thing to note here is the expansion of the time horizon. As soon as we start to consider longer time horizons of 14 days, we see that the returns of the Top 10 and Top 5 subsets make significant jump comparing to the shorter periods and reaches 0.8% and 1.53% by Top 10 and Top 5 on a months’ horizon, respectively. For time horizon of 3 months, the Top 10 signal and Top 5 signals performed much better than the S&P 500, where the Top 5 signals outperformed by 1.61%.
Conclusion
In this stock forecast evaluation, there is little doubt that our forecasts for stocks picked by I Know First’s AI Algorithm from the S&P 500 index universe outperformed the benchmarks. Based on the presented observations, we record significant outperformance of the Top 20 stocks filtered by predictability for all time horizons for both asset universes, and filtering further by signal strength.
Applying our predictability indicator as an investment criterion coupled with filtering by our signal strength, results in even greater outperformance over the benchmarks comprised of stocks from the S&P 500 index and the US stock market in general. That said, the Top 10 stocks from the S&P 500 index universe filtered by predictability and signal yield significantly higher returns than any other asset subsets on all considered time horizons spanning from 3 days to a month. Therefore, an investor who wants to critically improve the structure of his investments by adding US stocks to his portfolio can do so by simultaneously utilizing the I Know First predictability and signal indicators as criteria for picking stocks.
© 2019 I Know First Ltd. All Rights Reserved


