
Best Japanese Stock Market: Daily Forecast and Global Model Performance Evaluation Report
Executive Summary
In this stock market forecast evaluation report, we will examine the performance of the forecasts generated by the I Know First AI Algorithm for Japanese stocks which were daily sent to our customers. Our analysis covers the time period from 19 June, 2019 to 5 January, 2020. The report also demonstrates how our Global Stock Picking method compares to our Daily Forecast Model and how those generated predictions resulted in returns that beat the Nikkei 225 even during the volatile times in 2019.


Best Japanese Stocks Evaluation Highlights:
- Stock market forecasts that were generated by our Daily Forecast Model obtained positive returns and beat the Nikkei 225 for all time horizons.
- Top 5 by signal group for the Daily Forecast Model achieved the highest average return of 9.72% on the 90 days time horizon. It outperformed the Nikkei 225 index by a significantly high margin on the 30 and 14 days time horizons.
- The Global Model forecasts obtained positive returns for all time horizons.
The above results were obtained based on the stock market forecast evaluation over the specific time period using a consecutive filtering approach – by predictability and then by signal, to give a general overview of the forecasting capabilities of the algorithm for specific stock universe. In addition, we conducted alternative filtering based on our Global Model which is based on special signals filtering and will be explained further in a respective section. We will start with an introduction to our stock picking and benchmarking methods and then apply it to the Japanese stocks universe covered by us in the Japanese Package. After introducing the evaluation methodology in detail, we develop the analysis and present the evaluation results with relevant conclusions. This stock market forecast evaluation is part of our continuous studies of live I Know First’s AI predictive algorithm performance.
Evaluating Japanese Stocks Forecasts: The Stock Picking Method
In this evaluation analysis, we use two stock picking methodologies – our Daily Forecast Model and our new Global Model forecast method:

The Daily Forecast Model
We take the top 30 most predictable assets, and then we apply a set of signal-based filters: top 20, 10 and 5 based on predictability.
By doing so we focus on the most predictable assets on the one hand, while capturing the ones with the highest signal on the other.
We use absolute signals since these strategies are long and short ones. If the signal is positive, then we buy and, if negative, we short.
For example, a top 30 predictability filter with a top 10 signal filter means that on each day we take only the 30 most predictable assets, and then we pick from them the top 10 assets with the highest absolute signals.
Our Global Model Method For Top Japanese Stocks Market Forecast
The new stock-picking method takes all 10,500 assets that are forecasted by I Know First (the global set). The assets are then filtered by predictability and the top 30 most predictable assets are selected. Then those 30 stocks are scanned to see if there are any Japanese stocks – if there are such stocks, they are selected and then, based on the number of available assets, the signal filtering is applied at available levels to arrive at the top Japanese stocks.
As mentioned before, the asset universe under consideration is the full 10,500 set of assets covered by I Know First forecast and includes stocks, commodities and currency pairs. By implementing this new stock-picking method, we are selecting only the most predictable assets and the ones with the highest signals. Therefore, unlike our Daily Forecast picking method, the Global Model method provides a significantly stricter filter which outputs forecasts with narrower assets set. Note, that in case the Global Model filtering procedure is not passed by any of the Japanese stocks screened on a specific day, the system does not generate the forecast on this date until the stronger predictions come in.
About the I Know First Algorithm

The I Know First self-learning algorithm analyzes, models, and predicts the capital market, including stocks, bonds, currencies, commodities and interest rates markets. The algorithm is based on Artificial Intelligence (AI) and Machine Learning (ML) and incorporates elements of Artificial Neural Networks and Genetic Algorithms.
The I Know First Market Prediction System models and predicts the flow of money between the markets. It separates the predictable information from any “random noise”. It then creates a model that projects the future trajectory of the given market in the multidimensional space of other markets.
Since the model is 100% empirical, the results are based only on factual data, thereby avoiding any biases or emotions that may accompany human derived assumptions. The human factor is only involved in building the mathematical framework and providing the initial set of inputs and outputs to the system. The algorithm produces a stock market forecast with a signal and a predictability indicator. The signal is the number in the middle of the box. The predictability is the number at the bottom of the box. At the top, a specific asset is identified. This format is consistent across all predictions.
Our algorithm provides two independent indicators for each asset – signal and predictability. The signal is the predicted strength and direction of the asset’s movement. This is measured from -inf to +inf. The predictability indicates our confidence in that result. It is a Pearson correlation coefficient between past algorithmic performance and actual market movement. This is measured from -1 to 1.
A detailed description of our heatmap can be found here.
The Stock Market Forecast Performance Evaluation Method
We perform a stock market forecast evaluation on the individual forecast level. This means that we calculate the return of each forecast we have issued for each horizon in the testing period. We then take the average of those results by strategy and forecast horizon.
For example, to evaluate the performance of our 1-month forecasts, we calculate the return of each trade by using this formula:

This simulates a client purchasing the asset on the day we issue our prediction and selling it exactly 1 month in the future from that day.
We iterate this calculation for all trading days in the analyzed period and average the results.
Note that this stock forecast evaluation does not take a set portfolio and follow it. This is a different stock forecast evaluation method at the individual forecast level.
The Hit Ratio Method
The hit ratio helps us to identify the accuracy of our algorithm’s predictions.
Using our Daily Forecast and Global Model asset filtering, we predict the direction of movement of different assets. Our predictions are then compared against actual movements of these assets within the same time horizon.
The hit ratio is then calculated as follows:

For instance, a 90% hit ratio for a top 30 predictability filter with a top 10 signal filter would imply that the algorithm correctly predicted the price movements of 9 out of 10 assets within this particular set of assets.
The Benchmarking Method – Nikkei 225 Index
In order to evaluate our algorithm’s performance in comparison to the Japanese stock market, we used Nikkei 225 as a benchmark.
The Nikkei 225 (or commonly the Nikkei Heikin kabuki 225) is the leading index for the Tokyo Stock exchange and is a strong indication of how the stock market as whole is performing. Unlike other indexes that have developed a real time system, the Nikkei 225 is calculated by the traditional method and displayed on a daily basis by the Nihon Keizai Shimbun business newspaper. The Nikkei 225 is a price-weighted equity index, which consists of 225 stocks in the 1st section of the Tokyo Stock Exchange.
For each time horizon, we compare the Nikkei 225 performance with the performance of our forecasts after the filtering processes described above. For evaluating the performance of the forecasts that are filtered based on Global Model method, we compare those with the Nikkei 225’s average performance only when the Global Model filtering resulted in forecasts for Japanese companies. For example, if after our Global filtering the model recommended buying a given asset and hold it three days on five different occasions, the Nikkei 225 performance that we use as a benchmark will be the average of returns only in these five intervals of three days.
Performance Evaluation – Overview
We conduct our research for the period from June 19th, 2019 (date of the first ever forecast generated for this stock universe with Global Model) to January 5th, 2020 for both Daily Forecast Model and for Global Model. Following the methodology, as described in the previous sections, we start our analysis by computing the performance of the algorithm’s signals for time horizons ranging from 3 to 90 days with Daily Forecast model using predictability and signal filtering consecutively applied on Japanese stocks universe. Then we continue with the evaluation results for stocks picked with Global Model approach and consider what are the advantages and disadvantages of these models.
Performance Evaluation – The Signal Indicator Effect
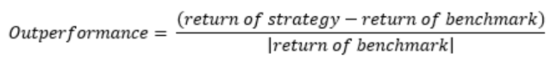
Once filtering by predictability is done, we utilize the signal indicator in our asset picking method to achieve the maximum forecast performance. It is important to measure it with respect to the benchmark, i.e. how the selected assets out-perform the benchmark, and for that, we will apply the formula:
We further filter and rank the assets based on absolute signal strength to the Top 20 assets under the Daily Forecast Model, which were already filtered by predictability.
We have filtered the stocks by predictability, selected the 30 most predictable stocks from the Japanese stock universe. The stocks are not necessarily all long or short positions, but they are a mix of both. That is because the I Know First algorithm is able to get return for both bull and bear market positions. Therefore, we applied filtering by signal strength to the top 30 assets filtered by predictability.
In parallel, we apply the Global Model method and compare the returns to Nikkei 225’s performance – the average Nikkei’s return measured for the same dates were stocks passed through Global Model filtering.
Top Japanese Stocks Results: Average Return, Hit Ratio and Out-performance

As can be seen above, by applying the top 30 predictability-based filtering method, we achieved positive returns for every time horizon. The signal-based filtering has a positive effect in returns, meaning that for every time horizon, filtering by signals always results in higher returns. In addition, the best performing subset is the top 5 signals which provides higher returns than all other filtering rules in the set across all time horizons. The highest performance was observed for 90-days time horizon with Top 5 signal filtering, where the algorithm achieved a return of 9.72%. Those results indicate that the signal effect on forecast average return is strong and consistent.
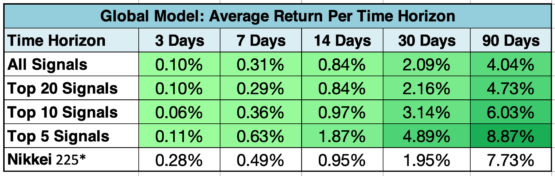
* according to the time frames of the forecasts when Global Model filtering is passed
As for the Global Model performance, we can observe that the best average returns are for the long time horizons (30 and 90 days). Moreover in 90 days horizon, the Global Model forecasts have higher average returns than the Daily Forecast Model for the top 10, top 20 and all signals groups. The best average return is 8.87% in the top 5 signals for the 90 days horizon. Furthermore most of the top 5 signals average returns are higher than Nikkei 225’s.

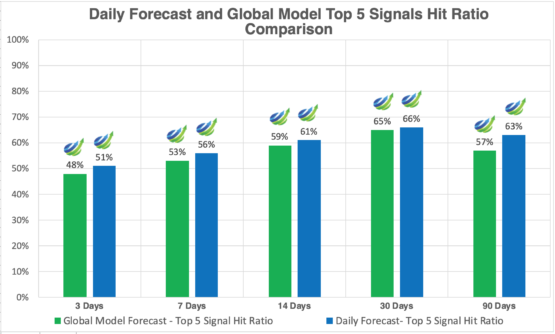
For all time horizons and filtering methods, hit ratios were higher than 50% accuracy. That means the accuracy is good. We can observe that the best Hit Ratio is in the top 5 signals for 30-days horizon.

The best Global Model Hit Ratio is also in the top 5 signals for 30-days horizon. According to the two tables above, the Daily Forecast Model and the Global Model provide almost equivalent results.
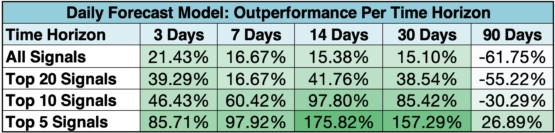
Finally, in accordance with the methodology described in the above section the out-performance of each model against Nikkei 225 performance was calculated. As can be seen in Table 4, the Daily Forecast Model successfully and consistently out-performs the benchmark except for the 90-days time horizon for the top 20, top 10 and all signals groups. We record that the signal filtering achieves the optimal results at the strictest filtering level of top 5 assets. Indeed, the highest out-performance was achieved by the top 5 signals group for the 14 days time horizon (175.82%) and in the 30 days time horizon (157.29%).

The out-performance showed by the Global Model is generally lower than the Daily Forecast Model. Despite negative out-performance results achieved by Global Model, the average return on each time horizon is positive and the top 5 signals group for the 30 days time horizon achieved an out-performance of 150.77% against the benchmark.
Conclusions
This evaluation report presented the performance of I Know First’s algorithm showing the average returns for all time horizons after the relevant filtering processes. The analysis demonstrates the efficacy of the Daily Forecast Model which forecasted assets groups that out-performed the benchmark Nikkei 225 in almost every time horizon.
According to this algorithm performance analysis for the Japanese stock market universe, the best performers were the assets in the top 5 signals group from the 30 most predictable ones for the 14 days and 30 days time horizons. I Know First’s research team will continue to monitor the changes in the performance trends of both models in order to evaluate our algorithm’s performance and derive relevant insights that will help provide the best algorithmic trading solutions to our clients.


