Top S&P 500 Stocks: Daily Forecast Performance Evaluation Report
In this stock market forecast evaluation report, we will examine the performance of the forecasts generated by the I Know First AI Algorithm for the S&P 500 stocks for long and short positions which were sent daily to our customers. Our analysis covers the period from October 9, 2018, to July 19th, 2020 and further analyzes the performance of the S&P stocks predictions for long and short positions and only long position.


S&P 500 Stocks Highlights
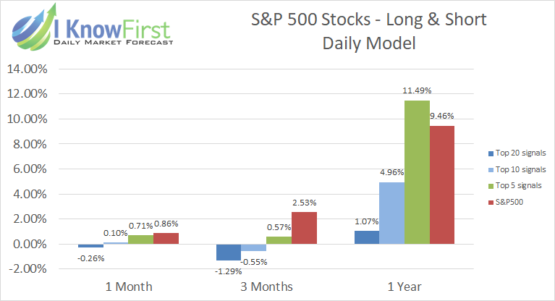
- In the short term horizons, all groups' signals outperformed the S&P 500.
- Our highest signals tend to have the largest returns over short term time horizons and over year long periods.
- Only long positions had higher returns than the Long and Short for each time horizon.
- Every signal group across every time horizon gave a hit ratio over 53%, showing consistent and reliable accuracy.
- Our top-5 signals had returns of 12.80% (Long Only) and 11.49% (Long and Short) over year long periods, handily beating the S&P 500 index.