
ETF Investing by Aggregating I Know First’s Algorithmic Trading Signals
In the following article we continue our analysis on computing sector-level predictions by aggregating I Know First’s stock-level forecasts and using these aggregated predictions to build strategies for sector ETF investing. In particular we:
- Update previously presented strategies which compute sector-level predictions by comparing the distributions of the long and short forecasts of the stocks within each sector
- Present new ways of aggregating our forecasts using simpler rules and show the performance of various strategies based on these
- Show that both the previously developed and the new simplified decision rules give rise to portfolios that beat the benchmark and register excellent risk statistics
I Know First Overview
I Know First is an Israeli Fintech company that brings artificial intelligence to the financial world by providing daily investment forecasts based on an advanced self-learning algorithm. This algorithm generates investment predictions for a universe of over 8200 assets which result in a daily ranking of investment opportunities. These can easily be integrated into investment selection processes and, combined with the appropriate strategy, be translated into portfolios with outstanding statistics for all types of investors.
Here we focus on ways of constructing predictions geared at ETF investing: in particular we compute investment signals for the 11 GICS sectors and use these to build trading strategies for the 11 SPDR sector ETFs. These ETFs contain S&P 500 stocks grouped by GICS sector classification and facilitate passive investment in specific sectors of the US economy.
Update of ETF Investing Using Stock-Level Forecast Aggregation
The concept behind the aggregation is to combine the information from individual, stock-level forecasts within each GICS sector to decide whether we are bullish, bearish, or neutral for the whole sector. To do this we map each of the S&P 500 stocks for which we generate daily investment forecasts to its unique GICS sector and use these mappings to compute predictions for the whole sector. Each sector’s predicted direction is determined by comparing the distributions of the long and short forecasts for the stocks within the sector using mean, median, and quantiles. We thus compute the sector-level prediction by determining which distribution (the long or short) is “larger” in the sense of the direction for which the stock-level forecasts are stronger. Note that instead of comparing the distributions of the signals we compare the predictability weighted signals (PWSs), thus incorporating the predictability indicator into the direction selection (see here for a description of the I Know First signal and predictability indicators). Moreover, we require that over 60% of the PWSs be in the direction of the sector we picked; if this is not fulfilled we mark the sector as neutral. This process results in a daily direction decision for each sector which can then be used for ETF investing.
We use these aggregated predictions to on a daily basis decide on a direction (long, short or neutral) for each of the 11 SPDR Sector ETFs and thus construct a portfolio that dynamically invests according to these predictions which adjusts its positions on a daily basis.
The following table gives the performance of 3 variations of long only aggregation based ETF investing strategies including commission costs ($0.005/trade) and spreads for the period 08/18/2015 – 11/01/2017.
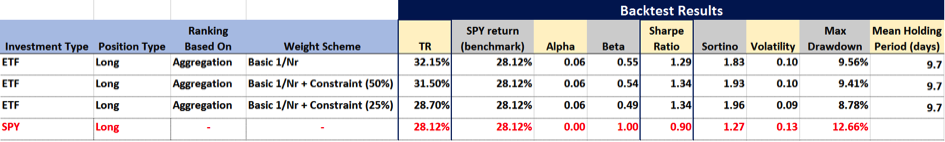
The 3 strategies differ in that they have different limits on the maximum percentage of the portfolio value that can be allocated to an individual position. The first strategy (top row) has no constraints, so for example if on a given day we are only non-neutral for 1 ETF we will invest the whole portfolio in that ETF. Instead the second and third strategy (second and third rows from the top) respectively limit each position to a maximum of 50% and 25% of the portfolio value: this means that we need at least 2 to 4 non-neutral positions to be fully invested. The fourth row presents the results of the benchmark, the SPY (ETF that tracks the performance of the S&P 500 index).
As can be seen in the table all 3 strategies beat the benchmark in terms of total return and present excellent risk and performance statistics:
- Total Returns up to 32.15% versus the benchmark’s 28.12%
- Sharpe Ratios above 1.29 versus the Benchmark’s 0.9
- Alphas above 5%
- Betas below 0.6
- Max Drawdowns below 9.6% versus the benchmark’s 12.66%
Below the evolution in time of the total return of the 3 portfolios is presented versus the benchmark (in red).
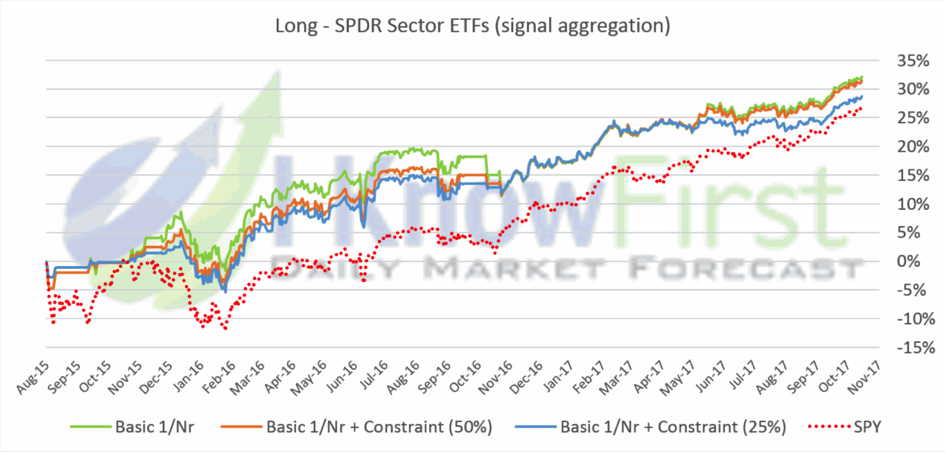
The chart shows how the ETF investing strategies ‘exit the market’ by correctly identifying downturns and go long in the bull market giving rise to smooth and consistently growing equity lines.
Another Approach to ETF Investing Through Stock-Level Forecast Aggregation Rules
Here we take a step backwards to simpler aggregation methods which decide on the direction for a specific sector without taking into account the strength of individual stock signals but only their direction. We compute the percentage of PWSs or sum up the predictabilities in the long and short directions for the tickers in the respective sector and use a threshold level to decide whether we are long, short or neutral on each sector. We then again construct ETF investing strategies for the 11 SPDR Sector ETFs using these aggregated sector-level predictions.
The following table gives the performance of 8 variations of long-short and long only aggregation based ETF investing strategies with the same threshold level including commission costs ($0.005/trade) and spreads for the period 08/18/2015 – 11/01/2017.
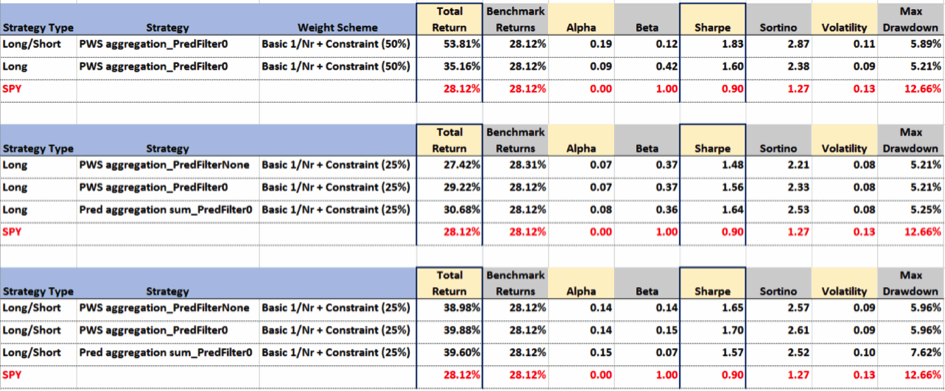
The first two strategies use a maximum weight per position (as explained previously) of 50%, while the following 6 a maximum weight of 25%. As can be seen 7 out of 8 strategies outperform the benchmark in terms of total return and all present excellent risk and performance statistics.
In particular the two best strategies (top table) respectively register:
- Total Returns of 53.81% and 35.16% versus the benchmark’s 28.12%
- Alphas of 9% and 19%
- Beta of 0.12 and 0.42
- Max Drawdowns of 5.89% and 5.21% versus the benchmark’s 12.66%
Below the equity lines of the 8 strategies are presented against the performance of the benchmark (in red).

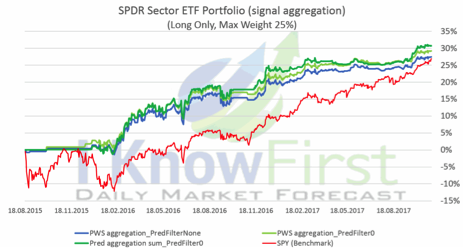

Again, one can see that ETF investing using I Know First’s aggregated algorithmic signals results in smooth, steadily growing equity lines which rotate in, out of, and short the ETFs in order to generate alpha and reduce volatility.
Conclusion
In this article we updated the results of a set of ETF investing strategies built on sector-level predictions computed through the aggregation of stock-level forecasts. These strategies which invest in the 11 SPDR Sector ETFs continue to outperform the benchmark even in this moment of great market expansion and register excellent performance statistics:
- Total Returns up to 32.15% versus the benchmark’s 28.12%
- Sharpe Ratios above 1.29 versus the benchmark’s 0.9
- Alphas above 5%
- Betas below 0.6
- Max Drawdowns below 9.6% versus the benchmark’s 12.66%
Moreover, we present a new set of forecast aggregation methods based on simpler decision rules and use these to again construct portfolios made up of the 11 SPDR Sector ETFs. These portfolios register an excellent performance over the 2-year time period analyzed and in particular the two best strategies result in:
- Total Returns of 53.81% and 35.16% versus the benchmark’s 28.12%
- Alphas of 9% and 19%
- Beta of 0.12 and 0.42
- Max Drawdowns of 5.89% and 5.21% versus the benchmark’s 12.66%


