
Hedge and Safe Haven Financial Assets
 This “Hedge and Safe Haven Financial Assets” article was written by Sergey Okun – Senior Financial Analyst at I Know First, Ph.D. in Economics.
Highlights
- Gold, short-term treasury bills, long-term treasury bonds, the spread between the long-term treasury and corporate bonds, 5-month volatility, and 1-month volatility are uncorrelated or negatively correlated with the S&P500 making them good candidates for the role of a hedge asset.
- 5-month and 1-month volatility as exchange trade products, and also the short-term government bills and long-term government bonds are able to play the role of a safe haven asset.
- Correlation analysis of the S&P500 and TNX shows that the correlation structure is not consistent from data frame to data frame.

For more than two years we have been living in a situation of high uncertainty because of the pandemic, economic lockdowns, interruptions in supply chains (for instance the chip shortage), inflation, and finally, the war situation in Eastern Europe which can provoke the energy crisis in Europe and the food crisis globally. All of these create demand for investment vehicles that can be recognized as a hedge or safe haven in different periods of the stock market dynamic. A strong (weak) hedge is defined as an asset that is negatively correlated (uncorrelated) with another asset on average. Also, we need to notice that a hedge does not necessarily have the property of reducing losses in periods of extremely declining markets as the asset could exhibit a positive correlation in such periods and a negative correlation in normal times, which could result in a negative correlation on average. A strong (weak) safe haven is defined as an asset that is negatively correlated (uncorrelated) with the stock market in periods of extreme stock market declines. The specific property of a safe haven asset is the non-positive correlation with the stock market in extreme market conditions. Also, we need to notice that this property does not force the correlation to be positive or negative on average but only to be zero or negative in specific periods of stock market declines. So, let us check the properties of such kinds of assets as precious metals, government bonds, the spread between government and corporate bonds, real estate, cryptocurrency, and stock volatility so they are recognized as hedge or safe haven assets.

(Table 1: Assets Description)
Table 1 presents financial assets and data frames for correlation estimation between the S&P500 and other financial assets. We also check the correlation between the stock market and the spread between government and corporate bonds (the long position in IEF and the short position in IGIB). Correlation coefficients have been estimated based on logarithmic daily returns of adjusted close prices provided by Yahoo Finance.
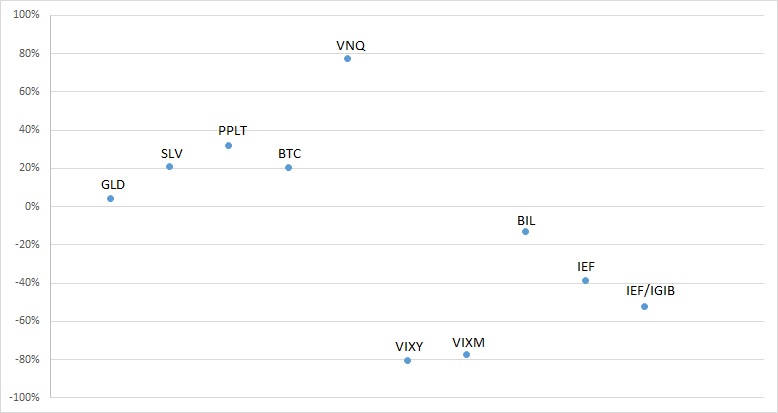
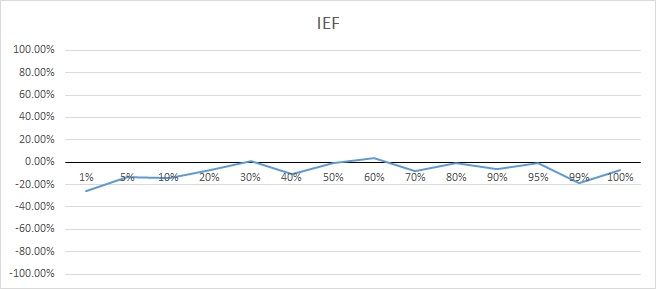
According to Figure 1, there are several candidates for the role of hedge and save haven assets. In general, gold, short-term treasury bills, long-term treasury bonds, the spread between the long-term treasury and corporate bonds, 5-month volatility, and 1-month volatility are uncorrelated or negatively correlated with the S&P500 making them good candidates for the role of a hedge asset. Also, there are small positive correlations of silver, platinum, and bitcoin, while real estate has a strong positive correlation with the S&P500. According to the definition of a safe haven asset, we are interested in assets which are uncorrelated or negatively correlated with the stock market during times of market stress or turmoil. In Table 2 we can notice conditional correlations between the S&P500 and other financial assets, and we are interested in assets which are uncorrelated or negatively correlated with the stock market at percentile intervals of the S&P500 returns from 0% to 10%.

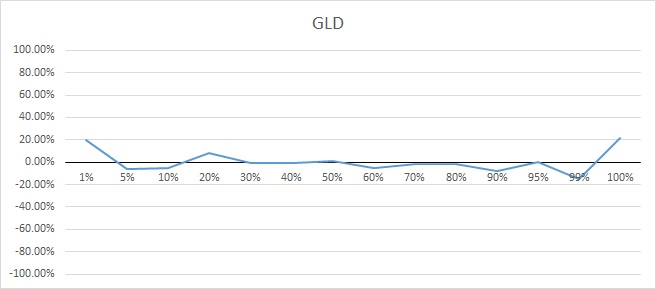
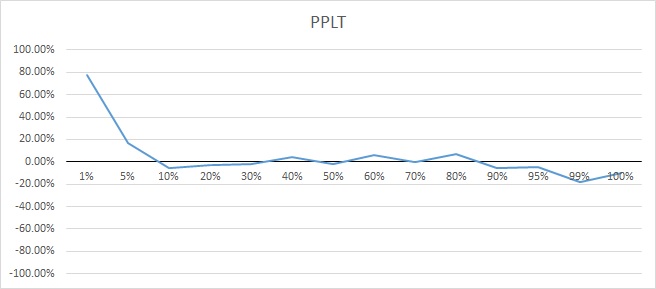
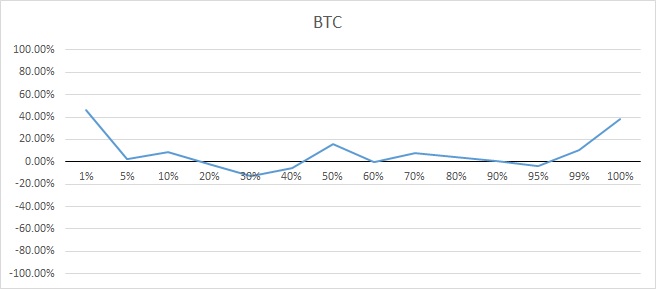
According to Table 2, gold, silver, platinum, bitcoin, and real estate are not truly safe haven assets when the S&P500 experiences the worst days (the percentile level from 0% to 1%) these financial assets move down with the stock market. However, gold, silver, and bitcoin are hedges in a case of pretty bad events at the percentile levels from 1% to 10%. At the same time, 5-month and 1-month volatility as exchange trade products, and also the short-term government bills and long-term government bonds are able to play the role of a safe haven asset. Moreover, the efficiency of using long-term government bonds as a safe haven asset can be increased by going long in the spread of IEF/IGIB (the long position in IEF and the short position in IGIB). In figures 2-11 we can notice the dynamic of the conditional correlation based on percentile levels.


Before, we have seen that IEF is a good choice for the role of a safe haven asset after the volatility exchange trade products. However, let us see the ability of long-term treasury bonds to be a safe haven asset in the past sixty years from June 16, 1962, to June 16, 2022. To analyze it, I take data for 10-year treasury yields (TNX) from Yahoo Finance and divide the dataset into six data frames with an interval of ten years. Increasing yield should have a negative effect on a bond price, which means that we expect to have a positive correlation between TNX and the S&P500 in a case where we get a negative correlation between IEF and the S&P500. In table 3, we can notice correlations between TNX and the S&P500 based on daily logarithmic returns.

According to Table 3, the correlation between the S&P500 and TNX is equal to 40.82% in the data frame from June 16, 2012 to June 16, 2022, which means when the S&P500 experiences the worst days (the percentile level from 0% to 1%), TNX moves down with the stock market provoking the price for 10-year Treasury bonds to go up, which goes in line with IEF correlation in Table 2. However, in Table 3 we can notice that the correlation structure is not consistent from data frame to data frame, which means that the correlation between the S&P500 and TNX depends on factors that could be unique in some period of time, and these factors together form a macroeconomic environment where we need to make investment decisions.
Investment with the I Know First AI Algorithm
Selecting correct assets, which can provide a hedge for an investment portfolio in normal time and protect a portfolio from big losses on extremely worst days, is an important part of risk management, and it is where the I Know First AI can help to find the most appropriate assets according to the current macroeconomic environment and changes in the structure of the financial market as we have seen in the case of the S&P500 and TNX.

I Know First is one leading company that has been effectively using machine learning and AI-based algorithms to provide daily forecasts and facilitate trading for over 10,500 financial instruments. More importantly, I Know First’s algorithm can fulfill the idea of discovering “fractals” and patterns using a more accurate way through AI and machine learning without involving any human judgments. The algorithms can present historical price patterns based on the data inputs, testing the performance on years of market data, and validating them on the most recent data to prevent overfitting. If an input does not improve the model, it is “rejected”, and another input can be submitted. I Know First provides different forecast packages based on the AI algorithm which allows us to select the most promising assets. Our artificial intelligence algorithm provides opportunities in the short term and also in the long term. We cover six different time horizons: 3 days, 7 days, 14 days, one month, 3 months, and one year, with the best long and short positions. For example, below you can see the result of different packages according to assets that we analyze in this article.

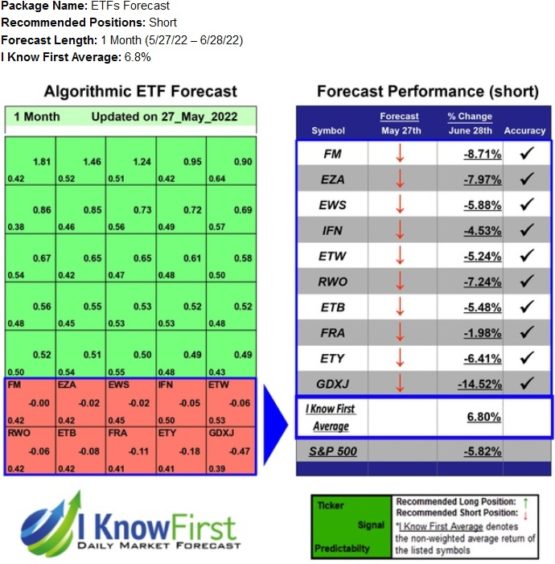


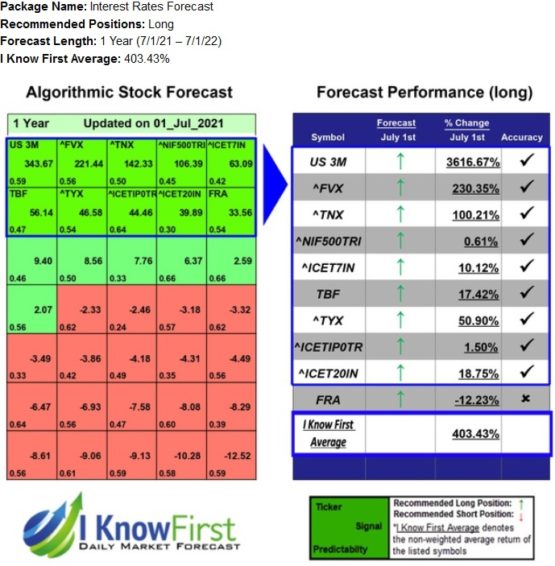

As we can see, the I Know First AI algorithm provides successful stock market forecasting across all mentioned kinds of assets. If you are interested in any of the packages mentioned above, you can have access to it here.
Conclusion
We have experienced economic turbulence and high uncertainty since the pandemic began in 2020 creating a demand for hedge and safe haven assets. We can see that gold, short-term treasury bills, long-term treasury bonds, the spread between the long-term treasury and corporate bonds, 5-month volatility, and 1-month volatility are uncorrelated or negatively correlated with the S&P500 making them good candidates for the role of a hedge asset. At the same time, 5-month and 1-month volatility as exchange trade products, and also the short-term government bills and long-term government bonds are able to play the role of a safe haven asset. However, from correlation analysis of the S&P500 and TNX, we see that the correlation structure is not consistent from data frame to data frame, which means that the correlation between the S&P500 and TNX depends on factors that could be unique in some period of time, and these factors together form a macroeconomic environment where we need to make investment decisions. The I Know First AI can help to find the most appropriate assets for improving portfolio diversification and finding the most promising investment opportunities according to the current macroeconomic environment and changes in the structure of the financial market.

To subscribe today click here.
Please note-for trading decisions use the most recent forecast.


