Aggressive Stocks: Daily Forecast Evaluation Report

Executive Summary

In this stock market forecast evaluation report, we will examine the performance of the forecasts generated by the I Know First AI Algorithm for the Aggressive stocks for long and short positions which were sent daily to our customers. Our analysis covers the period from December 20, 2019, to September 9th, 2020. 

Chart 1: Performance comparison for Top 20, Top 10 and Top 5 signals for Aggressive stocks vs S&P 500 for short term horizons since December 20th, 2020 until September 9th, 2020
Chart 2: Performance comparison for Top 20, Top 10 and Top 5 signals for Aggressive stocks vs S&P 500 for long term horizons since December 20th, 2020 until September 9th, 2020

Top Aggressive Stocks Highlights

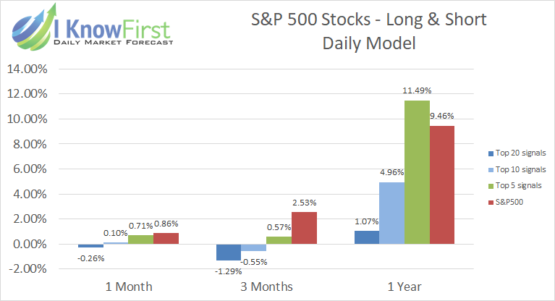
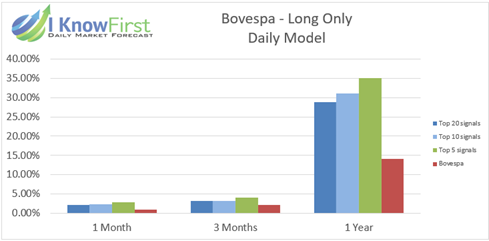
  • The Top 20, Top 10, and Top 5 signal groups generated by I Know First consistently outperformed S&P 500 Index for the short and long term horizons.
  • All the groups returns had a good performance, especially the ones for the 3 Months time horizon. Every group registered a return higher than 10%.
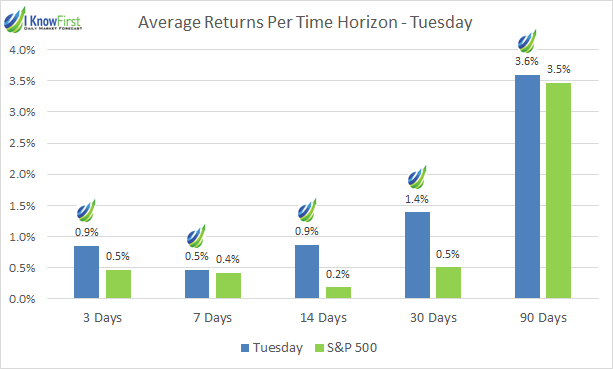
  • The Top 5 signal group outperformed the S&P 500 for almost 9 times for the 14 days time horizon.

Top S&P 500 Stocks: Daily Forecast Performance Evaluation Report

In this stock market forecast evaluation report, we will examine the performance of the forecasts generated by the I Know First AI Algorithm for the S&P 500 stocks for long and short positions which were sent daily to our customers. Our analysis covers the period from October 9, 2018, to July 19th, 2020 and further analyzes the performance of the S&P stocks predictions for long and short positions and only long position. 

Chart 1: Performance comparison for Top 20, Top 10 and Top 5 signals by Daily Model for only long position vs. S&P 500 for short-term horizons from October 9, 2018, until July 19th, 2020.
Chart 2: Performance comparison for Top 20, Top 10 and Top 5 signals by Daily Model for only long position vs. S&P 500 for long-term horizons from October 9, 2018, until July 19th, 2020.
Chart 3: Performance comparison for Top 20, Top 10 and Top 5 signals by Daily Model for long & short positions vs S&P 500 for short-term horizons from October 9, 2018, until July 19th, 2020
Chart 4: Performance comparison for Top 20, Top 10 and Top 5 signals by Daily Model for long & short positions vs S&P 500 for long term horizons from October 9, 2018, until July 19th, 2020.

S&P 500 Stocks Highlights

  • In the short term horizons, all groups' signals outperformed the S&P 500.
  • Our highest signals tend to have the largest returns over short term time horizons and over year long periods. 
  • Only long positions had higher returns than the Long and Short for each time horizon.  
  • Every signal group across every time horizon gave a hit ratio over 53%, showing consistent and reliable accuracy.
  • Our top-5 signals had returns of 12.80% (Long Only) and 11.49% (Long and Short) over year long periods, handily beating the S&P 500 index. 

Read more

Brazil Stock Market: Daily Forecast Evaluation Report

Executive Summary

In this stock market forecast evaluation report, we will examine the performance of the forecasts generated by the I Know First AI Algorithm for Brazilian stocks for long and short positions (20 stocks) which were sent daily to our customers. Our analysis covers the period from January 1st, 2018, to June 30th, 2020.

Brazil stock market
Chart 1: Performance comparison for Top 20, Top 10 and Top 5 long position signals by Daily Model vs Bovespa Index for short term horizons since January 1st, 2018 until June 30th, 2020
Brazil stock market
Chart 2: Performance comparison for Top 20, Top 10 and Top 5 long position signals by Daily Model vs Bovespa Index for long term horizons since January 1st, 2018 until June 30th, 2020
Brazil stock market
Chart 3: Performance comparison for Top 20, Top 10 and Top 5 long and short position signals by Daily Model vs Bovespa Index for short term horizons since January 1st, 2018 until June 30th, 2020
Brazil stock market
Chart 4: Performance comparison for Top 20, Top 10 and Top 5 long and short position signals by Daily Model vs Bovespa Index for long term horizons since January 1st, 2018 until June 30th, 2020

Brazilian Stocks Highlights

  • The Top 20, Top 10, and Top 5 signal groups generated by I Know First consistently outperformed Bovespa Index for almost all time horizons.
  • The Top 5 signal group outperformed the Bovespa by 16.23% using the 1 year time horizon.
  • All hit ratios for 7 day time horizon or longer are above 50%.
  • Using only long positions, every signal group for every time horizon outperformed Bovespa.
  • For long positions only, the top 5 signals with a 1 year time horizon outperformed the Bovespa Index by 21.07%.
  • Long position hit ratios for all time horizons longer than 3 days are above 50% and all 1 year forecast hit ratios are above 70%

Read more

Top S&P 500 Stocks Performance Report By Day Of The Week By I Know First Evaluation

Executive Summary

Is there a best day to start trading with I Know First AI signals? The purpose of this report is answer this question presenting the results of our live forecast performance evaluation for I Know First AI Algorithm, specifically for S&P 500 Stocks. The following results were observed when signal and predictability filters were applied, picking the top 5 signals out of the 30 most predictable ones. Also, the results were filtered by the day of the week the forecasts were generated and compared with the S&P 500. The period under evaluation is from January 1st, 2019 to April 1st, 2020. The corresponding returns distribution for S&P 500 stocks by day of the week are shown below:

Top S&P 500
Figure 1
Top S&P 500
Figure 2
Top S&P 500
Figure 3
Top S&P 500
Figure 4
Top S&P 500
Figure 5

S&P 500 Stocks Package Highlights:

  • No matter the day and the time horizon, the average return of the I Know First Algorithm is always positive.
  • There is a clear increasing trend for returns improvement with the time horizon.
  • Monday and Wednesday had higher returns on the short-term horizons on average.
  • The algorithm results consistently outperform the S&P 500 in every condition.

Read Full Report

Nvidia Stock Predictions: I Know First Stock Forecasts Evaluation Report

Nvidia Stock Predictions Executive Summary

In this forecast evaluation report, we examine the performance of the Nvidia stock predictions generated by the I Know First AI Algorithm for the NVDA with time horizons ranging from 3 days to 1 year, which were delivered daily to our clients. Our analysis covers the time period from 29 January 2019 to 27 March 2020. Below, we present our key takeaways for checking hit ratios of our Nvidia stock predictions in the stock market.

Highlights:

  • 100% Hit Ratio for a 1-year time period for Nvidia stock forecast allowing our clients to be able to invest their money with significantly less risk
  • Predictions consistently hit above 58% accuracy despite volatile market conditions

Read Full Report

Apple Stock Forecast: I Know First Stock Forecasts Evaluation Report

Apple Stock Predictions Executive Summary

In this forecast evaluation report, we examine the performance of the Apple stock forecast generated by the I Know First AI Algorithm for the AAPL stock with time horizons ranging from 3 days to 1 year, which were delivered daily to our clients. Our analysis covers the time period from 23 January 2019 to 23 March 2020. Below, we present our key takeaways for checking hit ratios of our AAPL predictions in the stock market.

Highlights:

  • 100% Hit Ratio for a 1-year time period for Apple Inc stock forecast allowing our clients to be able to invest their money with significantly less risk
  • Predictions consistently hit above 65% accuracy despite volatile market conditions

Read Full Report

Tesla Stock Predictions: I Know First Stock Forecasts Evaluation Report

Tesla Stock Predictions Executive Summary

In this forecast evaluation report, we examine the performance of the Tesla stock forecast generated by the I Know First AI Algorithm for the TSLA stock with time horizons ranging from 3 days to 1 year, which were delivered daily to our clients. Our analysis covers the time period from 1 January 2019 to 13 March 2020. Below, we present our key takeaways for checking hit ratios of our TSLA predictions in the stock market.

Highlights:

  • 100% Hit Ratio for a 1-year time period for Tesla stock forecast allowing our clients to be able to invest their money with significantly less risk
  • Predictions consistently hit above 57% accuracy despite volatile market conditions

Read Full Report