
Trading with Elliott Wave Pattern
 This article: “Trading with Elliott Wave Pattern” was written by Yuxiao Yang – Financial Analyst at I Know First.
Highlights:
- Elliott Wave Theory states that the movement of the stock market could be predicted by observing past prices and identifying a repeating up-and-down pattern of waves.
- Critics don’t support Elliott Wave Theory because they believe it is not accurate to predict the future trend only through subjective patterns from the price fluctuation in the stock market.
- Machine learning algorithms can find patterns in a huge number of data based on mathematical calculations of historical information.
Elliott Wave Theory
Elliott Wave Theory was developed by Ralph Nelson Elliott, who was an American accountant and author, in the 1930s. Elliott was inspired by the Dow Theory, which is a technical framework that indicates that the market is related to previous fluctuations. Similar to the Dow theory, Elliott wave theory believes that technical analysis involves past asset price and its movements already offer all necessary information for predicting the future trend. At the same time, developed by the Dow Theory, Elliott Wave Theory states that the movement of the stock market could be predicted by observing past prices and identifying a repeating up-and-down pattern of waves. Elliott’s wave theory describes specific rules that how to identify and predict these wave patterns.
The Elliott Wave theory identifies two different types of waves: motive waves (also known as impulse waves) and corrective waves. Impulse waves consist of five sub-waves that make net movement in the same direction to the trend of the next-largest degree, corrective waves consist of three or a combination of three sub-waves that make net movement in the direction opposite to the trend of the next-largest degree.
Motive Waves
For Motive, waves include two different types: Diagonal and Impulse. The Diagonal pattern and Impulse pattern have three common rules:
- wave 2 cannot retrace more than 100% of wave 1;
- wave 3 is not the shortest of waves 1,3,5;
- wave 4 can not go beyond the third wave at any time.
The figure below indicates the difference between these two patterns. Diagonal has a pattern of 3-3-3-3-3, which means every wave in the Diagonal pattern has three moves; the Impulse has a pattern of 5-3-5-3-5, which means every wave in the Diagonal pattern has five moves. Other than structure, how wave 4 interacts with wave 1 is different between the Diagonal pattern and Impulse pattern: for the Diagonal pattern, wave 1 overlaps wave 4, for impulse, wave 4 could overlap wave 1.

Corrective Waves
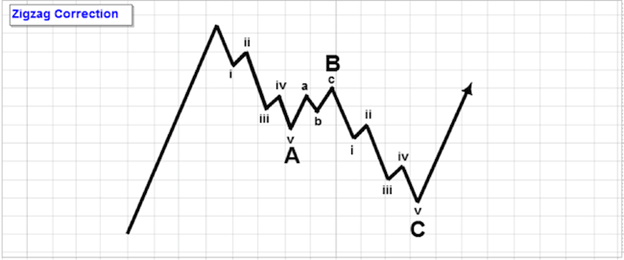
There are two patterns of corrective waves, the “sharp” correction and the “sideways” correction. The sharp corrections move steeply against the trend of one higher degree, while the sideways correction appears to form a flat type of structure. As the figure is shown below, Zigzag Corrections is a representative type of sharp correction wave.
As shown below is a “sideways” pattern, called “Flat Correction”, the pattern moves in a sideways direction.

Elliott Wave Criticism
However, many opponents of Elliott Wave’s theory do not believe it is valid, critics say the limitations of Elliott Wave’s theory lie in its inability to test the validity of the judgment in a timely manner. Critics point out that we won’t recognize an Elliott wave until it passed, because the pattern of the waves only can be detected after the waves passed.
Ralph Elliot applied the Fibonacci ratio to his Waves in the 1940s, but for the most part of Elliott Waves in the Dow Jones Industrial Average did not exhibit the Fibonacci ratio. Elliot Wave is not specifically related to the Fibonacci ratio. It is not accurate to predict the future trend only through the price fluctuation in the stock market, because we need to truly understand the reasons and meanings behind the price fluctuation.
Machine Learning as a Better Instrument of Pattern Recognitions
Machine learning allows computers to learn from data and use that knowledge to make pattern recognition. The ML algorithms learn through the training data from historical information also used as target variables, then test against the target variables in the validation dataset to verify its accuracy. The goal is to create a model that can accurately predict the target variable when it is exposed to relevant predictive variables.
In this way, the algorithms help us better observe market data patterns. Machine learning algorithms can find patterns in a huge number of data based on mathematical calculations of information such as prices and volatility. They are used to find patterns in historical data and then apply them to algorithmic trading strategies. Elliott Wave works in the framework of the Technical Analysis theory. But Technical Analysis is performed by human eyes, and thereby it can only capture general trends and can suffer in terms of accuracy. On the other hand, machine algorithms can capture all useful patterns through training, allowing for a faster, more precise exploration of historical stock prices.

I Know First is one leading company that has been effectively using machine learning and AI-based algorithms to provide daily forecasts and facilitate trading for over 10,500 financial instruments. More importantly, I Know First’s algorithm does not depend on any human derived assumptions except for the mathematical framework initially presented, meaning that it is more reliable and accurate than using technical indicators which involve a lot of human judgments. The algorithms can present patterns based on the data inputs, testing the performance on years of market data, and validating them on the most recent data, which prevents overfitting. If an input does not improve the model, it is “rejected”, and another input can be submitted. I Know First uses algorithmic outputs from the S&P500 Stocks package to provide an investment strategy for institutional investors.

The investment strategy that was recommended to institutional investors by I Know First accumulated a return of 61.66% which exceeded the S&P 500 return by 42.23%. With this excellent outcome presented, I Know First’s algorithm can be considered as an expert player in finding patterns and trends and making investment decisions more reliable and accurate.
If you are interested in our forecasting packages, you can have access to it here.
Conclusion
Elliott wave theory works in the frame of Technical Analysis and provides a theoretical view of a price dynamic. However, there is a lot of criticism about the Elliott waves, and one of the most important is that it is difficult to recognize Elliott waves in practice. Machine learning allows recognizing price patterns that could not be captured by human eyes and good performance of the I Know First algorithm in 2021 across a wide range of financial markets even support this statement.

To subscribe today click here.
Please note-for trading decisions use the most recent forecast.


