
Win the Stock Market Game: Machine Learning vs Technical Analysis
 This algorithmic article was written by Yutong Li – Analyst at I Know First, Master’s candidate at Brandeis University.

Highlights:
- The technical analysis seeks to explore past price trends using various indicators and behavior patterns to predict the future movements
- Similar to technical analysis, machine learning is also performing well in navigating patterns and trends from historical stock prices
- Although both technical analysis and machine learning are powerful tools in trading, there are still some problems that technical analysis has but machine learning can smartly handle
What Is Technical Analysis?
Technical analysis has been prevalently used in stock trading for a very long time. In fact, the foundation of technical analysis can be traced back to Charles Dow and his Dow Theory in the late 1800s. There are six basic components that underpin Dow Theory, and it is the first theory to explain that the market moves in trends. According to Investopedia, Dow Theory follows the main idea that the market is in an upward trend if one of its averages advances above a previous important high and is accompanied or followed by a similar advance in the other average. Also, Dow believed that the stock market as a whole was a reliable measure of the overall business conditions within the economy, and people can evaluate the conditions and identify the direction of market trends and the direction of stocks.
Dow Theory has evolved and formed the core of the modern technical analysis. As we know it today, technical analysis is the study of past stock market data in order to forecast the direction of future price movements and explore trading opportunities. In addition, there are three main assumptions for technical analysis:
- The market discounts everything: this is consistent with the Efficient Markets Hypothesis and states that the stock prices include all available information in the market.
- Price moves in trends: technical analysis expects the stock prices to follow certain patterns and trends.
- History tends to repeat itself: it also believes that what happened in the past will likely happen again in the future following a similar pattern.
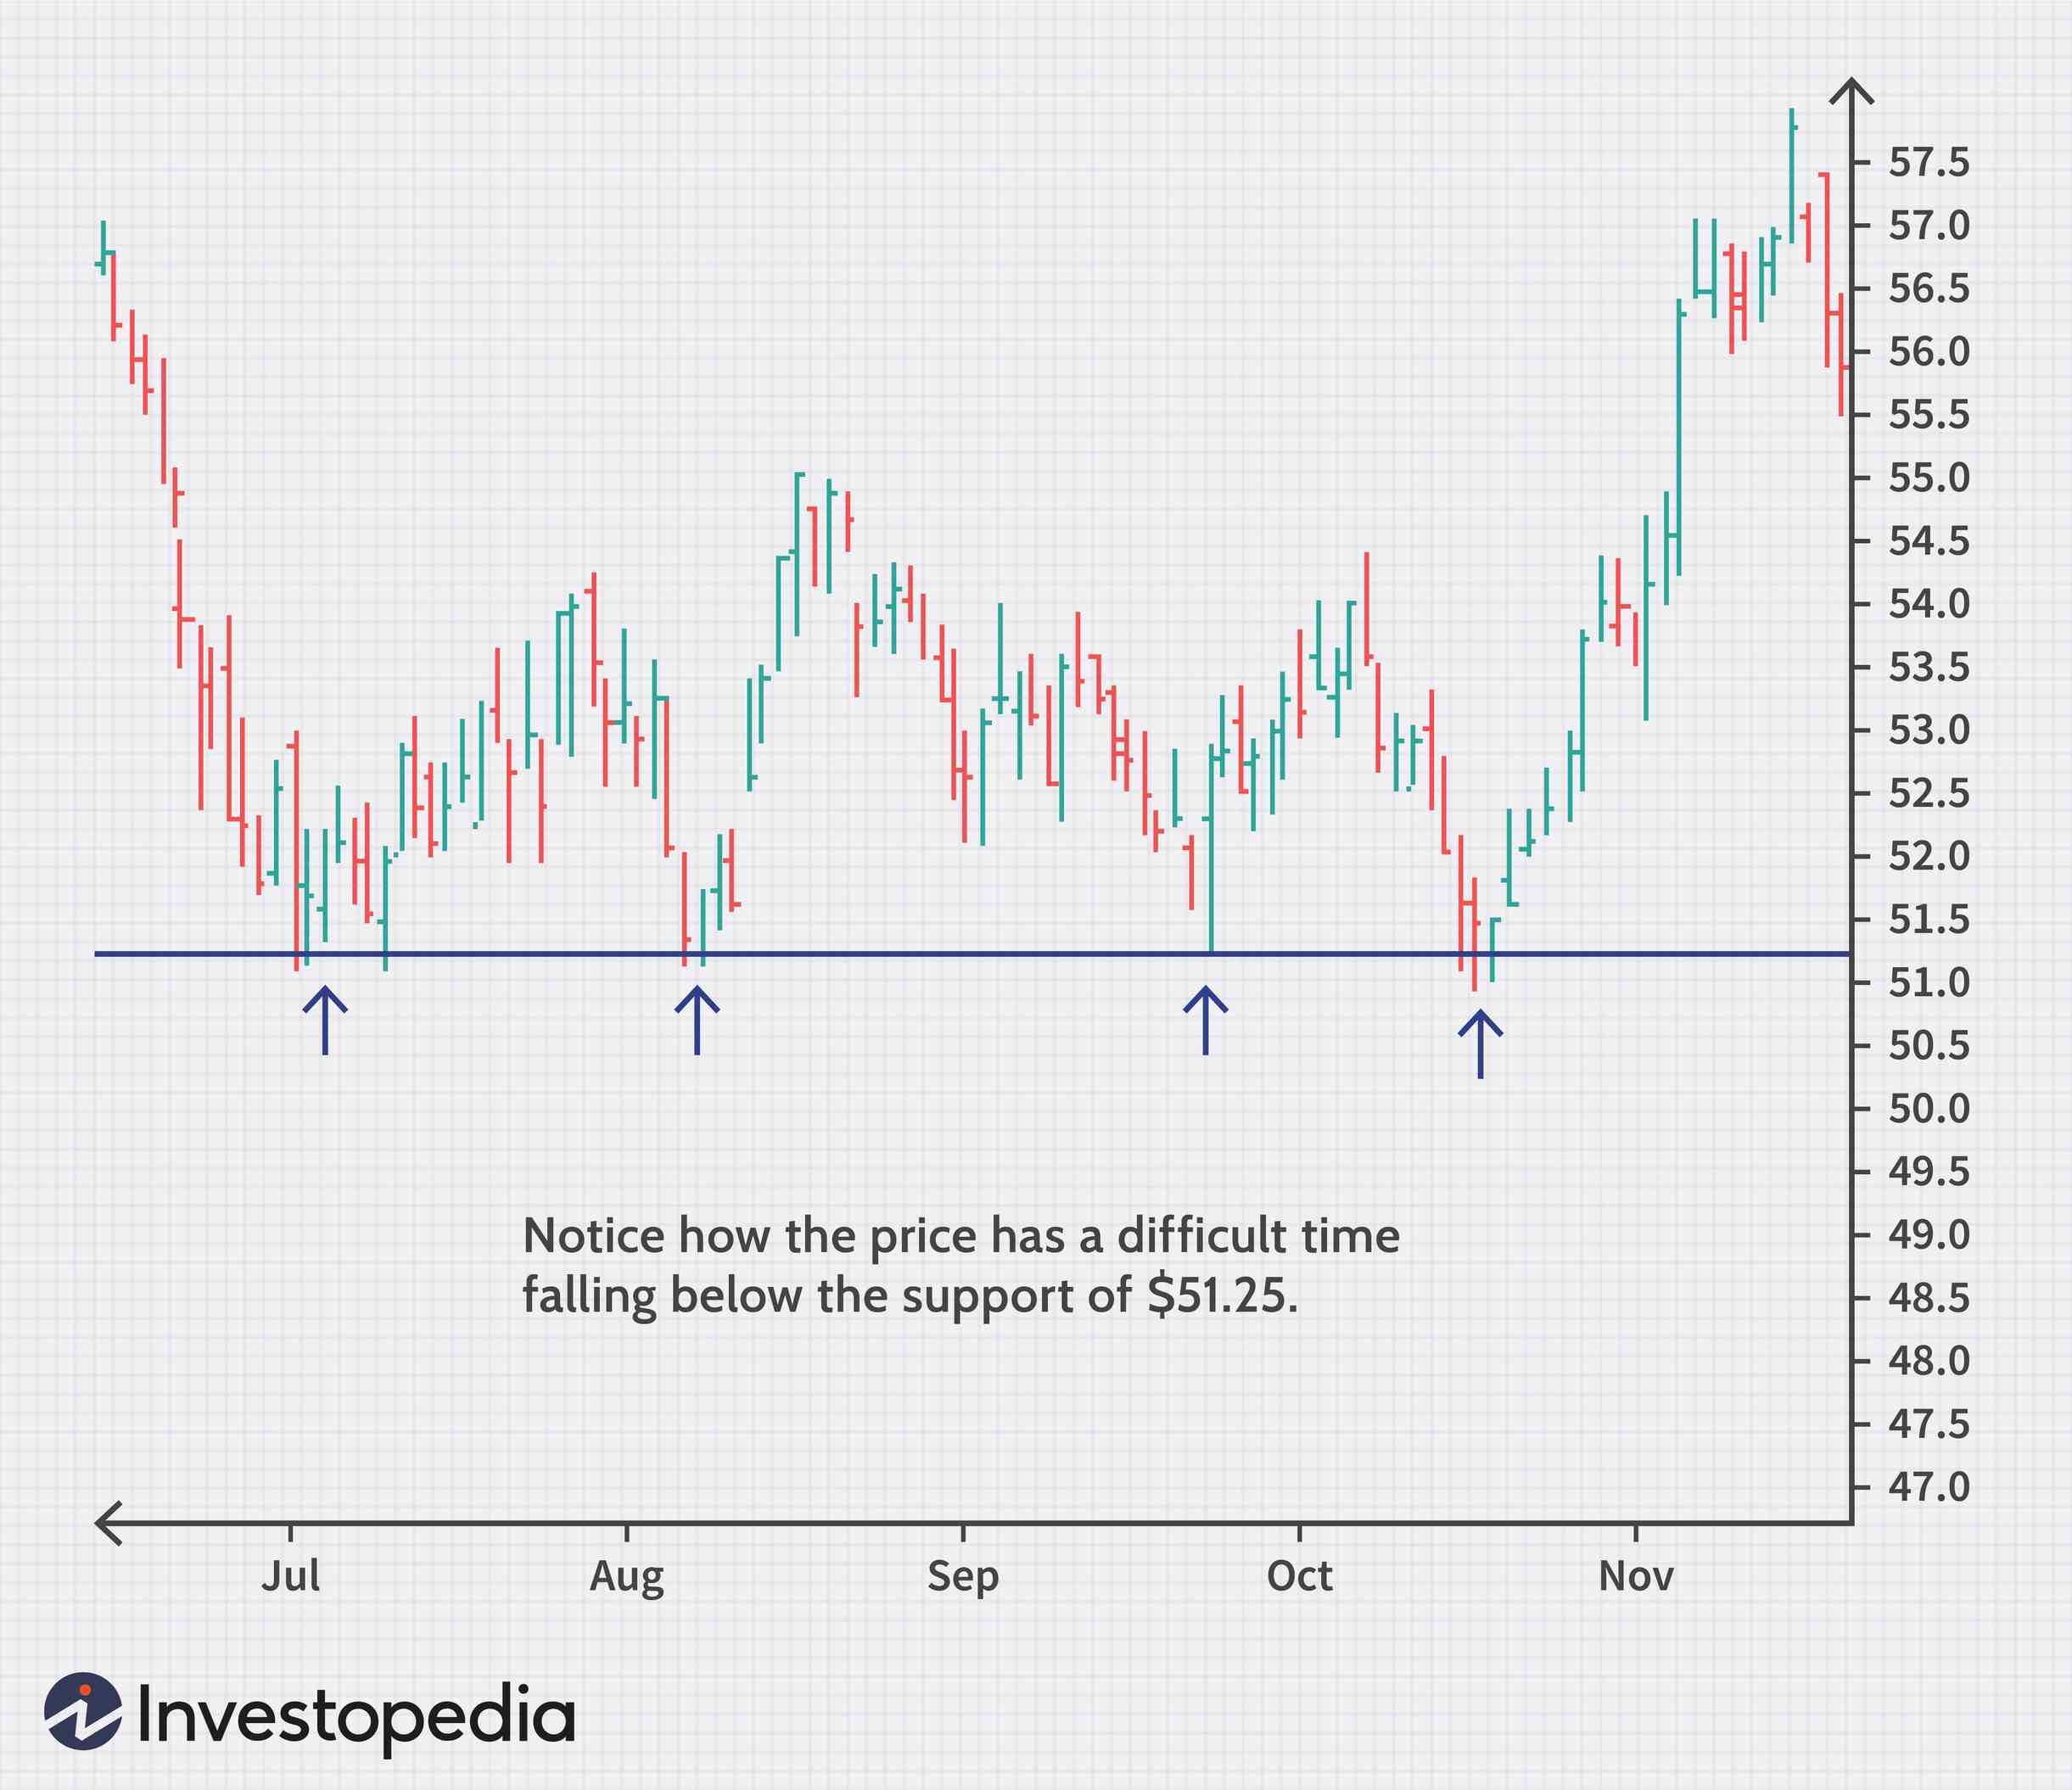
In general, there are two directions to approach technical analysis: indicators and price patterns. Technical indicators are used to generate buy and sell signals. Some well-known indicators include: Moving Average Lines, Bollinger Bands, MACD, and etc. On the other hand, price patterns are used to identify price movements with a series of trend lines and curves. These commonly used price patterns include Support and Resistance Levels, Head and Shoulders, and etc. The below graph is one example of a support level. Once a price reaches a point of support or resistance, it will either bounce back away from support or resistance level, or violate the price level and continue in its direction until it hits the next support or resistance level. The price of $51.25 here tends to act as a floor that prevents the price from going down further.
Furthermore, many investors also prefer to combine different technical indicators that work best for them with chart patterns to make better decisions.
The Link between Technical Analysis & Machine Learning

Nowadays, machine learning has become another robust instrument that provides advisable suggestions on trading. We can easily find out that machine learning and technical analysis have some concepts in common, and machine learning can actually fulfill the ideas of technical analysis perfectly.
As we introduced earlier, technical analysis is a study of patterns from historical stock prices. So is machine learning. In technical analysis, humans take price charts as input, then we use indicators to process the charts, exploring patterns by eye and making effective decisions. Similarly, when it comes to machine learning, the input now becomes historical data, and the data is processed by computers, not humans, through a training process. After the patterns are found, the output is created by computers to provide useful trading recommendations.
As a result, the ideas of technical analysis can also be realized in machine learning. Moreover, machine learning is an advancement of technical analysis as it can automate what technical analysis does, but it can even do more than technical analysis and produce more effective insights to investors.
Machine Learning Can Take Over
Admittedly, both technical analysis and machine learning are powerful tools in stock trading and provide guidance to investors. However, there are still some issues of technical analysis that machine learning can address. Now, let’s see what the limitations are existing in technical analysis and how these problems can be smartly addressed by computer algorithms.

Market Trends Spotted Less Accurately
Technical analysis is performed by human eyes, and thereby it can only capture general trends and can suffer in terms of accuracy. On the other hand, machine algorithms can capture all useful patterns through training, allowing for a faster, more precise exploration of historical stock prices.
Tools Are Too Widely Known
Nowadays, technical analysis indicators and techniques are available to everyone, and this can lead to diminishing profit potential. Nevertheless, machine learning algorithms are developed for different purposes. And many people favor ensemble learning and would like to build their own combined model to increase accuracy scores. Once a good model is produced, implementing machine learning can give a competitive advantage in stock trading.
Technical Analysis Does Not Take External Factors into Account
Another shortcoming of technical analysis is that it cares little about external factors besides the stock price itself, for example, the companies behind the stocks they trade, the overall industry conditions, etc. Contrarily, machine learning can take other useful variables into account and add them as features in training. Some techniques such as decision trees, random forests, etc. can also rank feature importance and show which features can be critical in determining the stock trends and directions.
Technical Analysis Interpretations Can Be Affected Human Bias
While technical analysis is based on the actual data, the majority of indicators interpretations rely upon subjective judgements. Here’s where the problem lies. As humans, our judgements are easily influenced by emotions and cognitive biases, so our decision based on technical analysis may also be biased. For instance, when traders who favor a long position see bearish bars showing up, they tend to ignore the bearish signs. This is the confirmation bias that happens commonly in technical analysis: traders give more weight to information that confirms their thoughts and disregard things that contradict their ideas. However, machine learning can perfectly avoid this problem as it only follows instructions by computer algorithms, and it can capture all information that is showing to us impartially.

Therefore, we can see how machine learning can cleverly address the issues existing in technical analysis. In other words, it not only can automate the ideas of technical analysis in terms of finding patterns, but also can make decisions more efficiently and accurately.
I Know First’s Machine Learning Based Algorithm
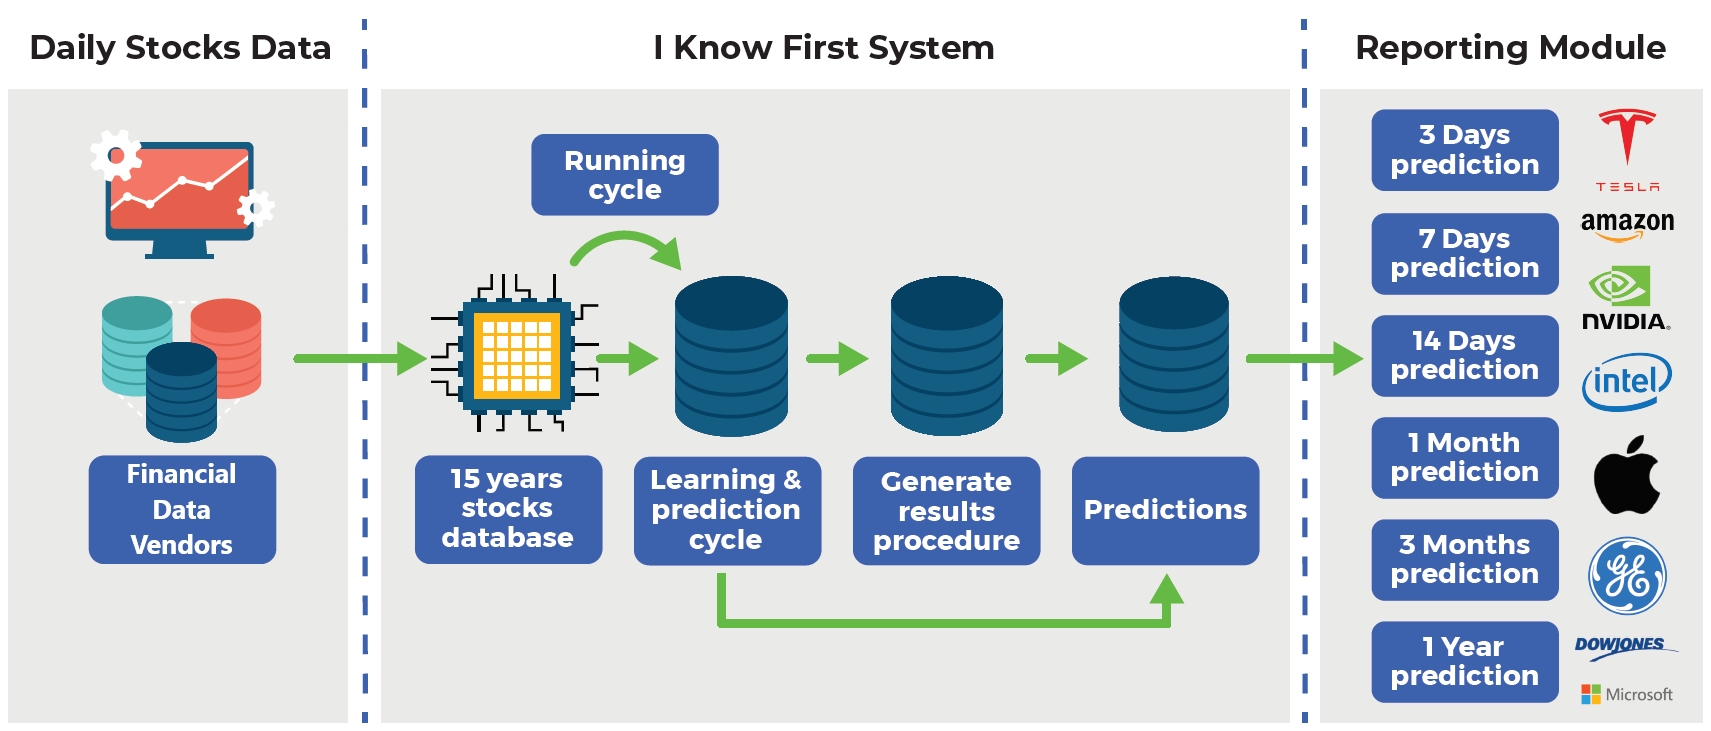
I Know First is one leading company that has been effectively using machine learning and AI-based algorithms to provide daily forecasts and facilitate trading for over 10,500 financial instruments. More importantly, I Know First’s algorithm does not depend on any human-derived assumptions except for the mathematical framework initially presented, meaning that it is more reliable and accurate than using technical indicators which involve a lot of human judgements. The algorithms can present patterns based on the data inputs, testing the performance on years of market data, and validating them on the most recent data, which prevents overfitting. If an input does not improve the model, it is “rejected”, and another input can be submitted.
I Know First’s machine learning algorithms have brought great predicting success as shown in the below performance evaluation graph of top US market index forecasts for long-term horizons. We can see that the best hit ratio on a 1-year time horizon has reached 100%, and the average ratio for this 1-year period has got to 97.2%.

Conclusion
Although technical analysis has been a powerful tool for investors’ decision-making ever since it was first introduced by Dow Theory, machine learning is capable of what technical analysis does as well and can find patterns even more effectively. This is due to the fact that technical analysis primarily uses charts and human judgements, while machine learning is based on historical data without any human bias, and its training process can also guarantee an enhanced validity. Moreover, we have seen how I Know First’s machine learning algorithm is performing with high accuracy. Therefore, we can trust the full potential of machine learning as a reliable tool in trading. And we can be optimistic to see how it can help us in winning the stock market game now and in the future.

To subscribe today click here.
Please note-for trading decisions use the most recent forecast.


