DJI/RUT Stock Forecast: Large-Cap Stocks VS Small-Cap Stocks in the Period of Macroeconomic Instability
This “DJI/RUT Stock Forecast: Large-Cap Stocks VS Small-Cap Stocks in the Period of Macroeconomic Instability” article was written by Sergey Okun – Senior Financial Analyst at I Know First, Ph.D. in Economics.

Highlights:
- The DJI/RUT spread of 16.64 is lower than the historical level of 17.19.
- Economic uncertainty increases the attractiveness of large-cap stocks due to their financial sustainability.
- The I Know First AI algorithm provides a higher signal forecast for DJI than for RUT in the 1-year time horizon.
Any economic and geopolitical shocks provoke reactions on financial markets that provide investment opportunities in different time horizons. At the same time, a shock based on its characteristics could have an effect on an economic system as a whole or on separate parts of an economic system in particular. Overall, we can say that we live today in the frame of two independent shocks: 1. COVID-19; 2. The military situation in Ukraine and the increasing economic isolation of Russia. Moreover, the pandemic shock is a complex shock that includes several sub shocks such as: the COVID-19 introduced at the beginning of 2020; government economic support, which we have had for more than 2 years; Delta and Omicron cases; the inflation rose; the chip shortage and etc. Both of these shocks have different effects on different stock groups both large-cap and small-cap stocks which are represented by the Dow Jones Industrial Average index (DJI) and Russell 2000 (RUT).

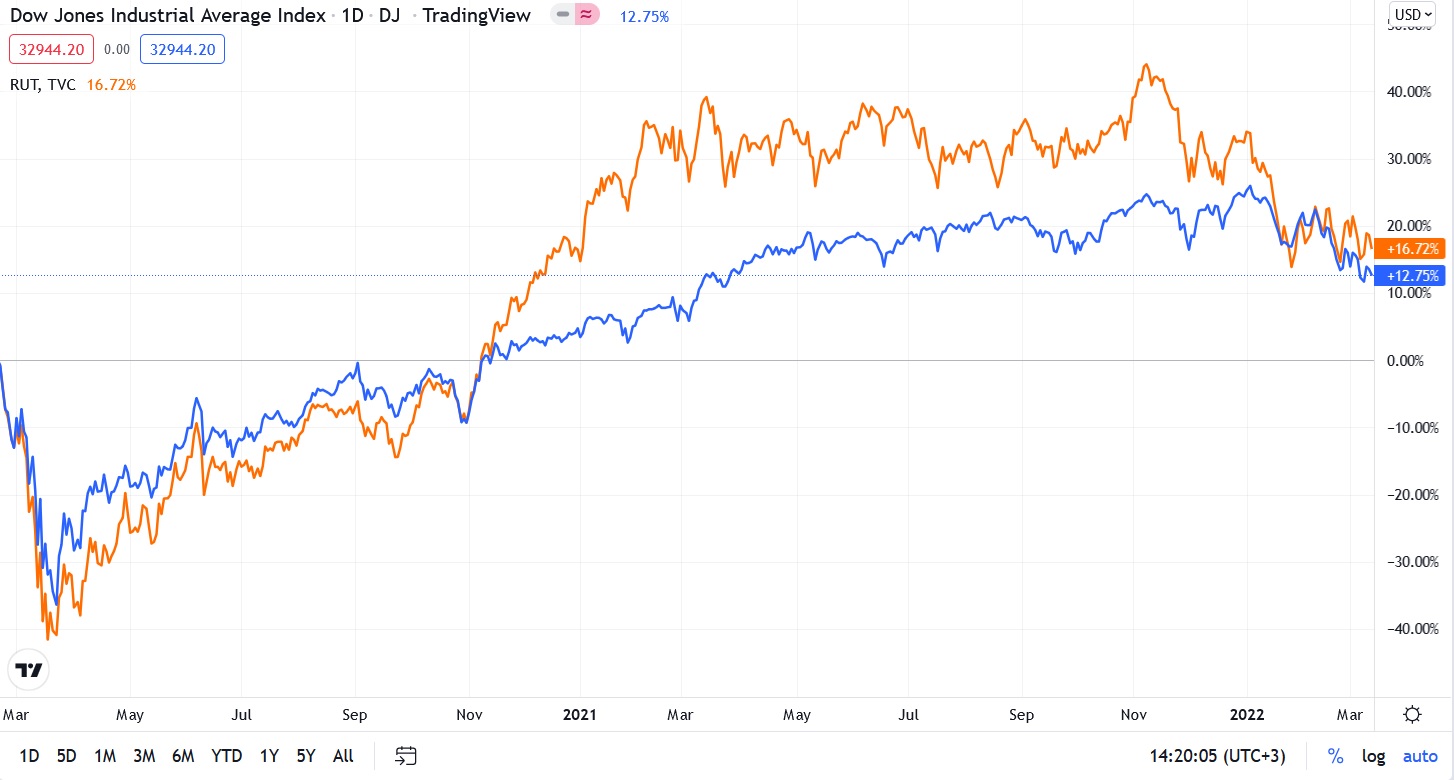
Both DJI and RUT have increased since February 20th, 2020 by 12.75% and 16.72% respectively. When the COVID-19 introduced itself at the beginning of 2020, the DJI and RUT dropped by 36.37% and 40.90% respectively from February 20th to March 23rd, 2020. The bigger drop of small-cap companies compared to large-cap stocks could be explained by the fact that large-cap companies are more financially sustainable for a systematic shock. Also, the fact of financial sustainability explains why the DJI performed better than the RUT until November 2020. I suppose that the significant rise of the RUT from November 2020 until March 2021 is connected with the invention and implementation of vaccines that facilitated expectations of the business activity growth.
It is interesting to point out that while the DJI had an uptrend dynamic during the whole of 2021, the RUT stayed in the flat from March 2021. The flat dynamic of the RUT could be explained by the fact that around in March-April the FED began to speak about decreasing the government’s economic support to deal with expected inflation, which increased the market uncertainty and provided more attention to large-cap stocks. Government support is the main factor of the stock growth in the pandemic time. For instance, according to the FED the money supply aggregator M2 increased by 41.18% from February 2020 to January 2022.

The stock market decreasing in 2022 is connected with two factors: the realization of the inflation risk and the military crisis between Ukraine and Russia. Inflation has a negative impact on all companies in the economic system. The DJI decreased by 9.44% from January 3rd, 2022 to February 23th, 2022 while the RUT decreased by 14.45% for the same period of time, which underlines that large-cap stocks are more sustainable for this kind of economic risk. Currently, it does not look like the crisis in Ukraine has a significant impact on the stock market now, so for the period of February 23rd to March 11th the DJI decreased by 0.57% while the RUT increased by 1.83%. This can be explained by the following two reasons. Firstly, it means that investors in the US are more concerned about the FED monetary policy than sanctions against Russia despite the fact that the rise of commodity prices provokes temporary inflation growth. Secondly, the worse performance of large-cap stocks means that these stocks are more likely to be affected by the Russian sanctions shock than small-cap companies, and it needs time for big companies to reorganize their business activity.
Let us look carefully at the statistics description of the Dow Jones Industrial Average Index and the Russell 2000. Below, I have calculated the annualized daily mean and volatility based on log return for 252 trading days (by using daily closed prices from YahooFinance.com) for the period of January 2nd, 1992 – March 11th, 2022. According to Table 1, the Russell 2000 is a riskier stock universe with a high grade of risk compared to the Dow Jones Industrial Average Index. Moreover, we can notice that the annualized daily spread return of DJI/RUT is equal to 0.78% with an annualized daily volatility of 12.70%.

The historical daily average DJI/RUT spread is equal to 17.19 for the period of January 2nd, 1992 – March 11th, 2022, which is higher than the current spread of 16.64 on March 11th, 2022. Looking at the spread dynamic we can see, one more time, the track between large-cap and small-cap stocks in the pandemic reality. Firstly, when the pandemic shock introduced itself, the spread significantly increased and reached its peak of 20.07 on March 3rd, 2020; thereafter the economic system adapted to the pandemic reality and the spread reached its bottom level of 13.64 on February 9th, 2021; after that, the risk of decreasing the government support and threat of inflation have formed two rises in the spread until this day.

According to our previous description, uncertainty and government economic support are the main factors of the stock market dynamic in general and the DJI/RUT spread in particular. Historically, the correlation between the DJI/RUT spread and VIX, and the DJI/RUT spread and TNX (Treasury Yield 10 years) are equal to 0.18 and -0.11 respectively (the correlation coefficients are calculated based on a daily logarithmic return for the period of January 2nd, 1992 – March 11th, 2022). At the same time, connections between economic variables can change depending on the characteristics of economic processes in the economic system. Currently, on March 11th, correlation coefficients of DJI/RUT with VIX and TNX are equal to 0.37 and -0.15 respectively. Moreover, we can notice that correlation between DJI/RUT and VIX has been increasing since March 2020.

While government support is the main factor that contributes to the stock market growth in the pandemic time, the monetary policy could be the main source of a volatility surge, as we saw before the FOMC’s meeting on January 26th, 2022. Federal Reserve Chairman Jerome Powell said that the central bank still plans on raising interest rates despite the “highly uncertain” economic effects of the conflict in Ukraine by 0.25% instead of 0.50% as planned before. I suppose that currently, the FED’s more careful monetary policy will postpone more aggressive measures to deal with inflation in the future that will create more cases of volatility surge and will increase the attractiveness of large-cap stocks compared to small-cap stocks to deal with uncertainty.

It is worth highlighting that the stock-picking AI of I Know First supports my position on the higher attractiveness of the Dow Jones Industrial Average index (DJI) compared to Russell 2000 (RUT) in the 1-year time horizon. Also, going long in the spread DJI/RUT will allow an investor to decrease the volatility of an investment position and even get profit on a decreasing market in case the DJI will decrease less than RUT.
DJI/RUT Stock Forecast: Conclusion
The stock market has been living in a period of shocks since 2020, which has transformed the economic system and provided investment opportunities. A shock increases uncertainty in the market, while the system is adapting to a new reality, and increasing the attractiveness of large-cap stocks, which are more financially sustainable compared to small-cap stocks. The government’s economic support was one of the main factors that allowed the stock market to adapt to the pandemic shock in 2020 and 2021. However, today we have a statement from the FED to decrease the economic support to deal with inflation and the geopolitical crisis in Ukraine. Moreover, the risk of a new Covid mutation appearing is still possible. Thereby, I suppose that we should expect more cases of volatility surges in the future, which makes investment in large-cap stocks more attractive. The I Know First AI algorithm supports my position providing a higher signal forecast for Dow Jones Industrial Average Index than for Russell 2000 in the 1-year time horizon.


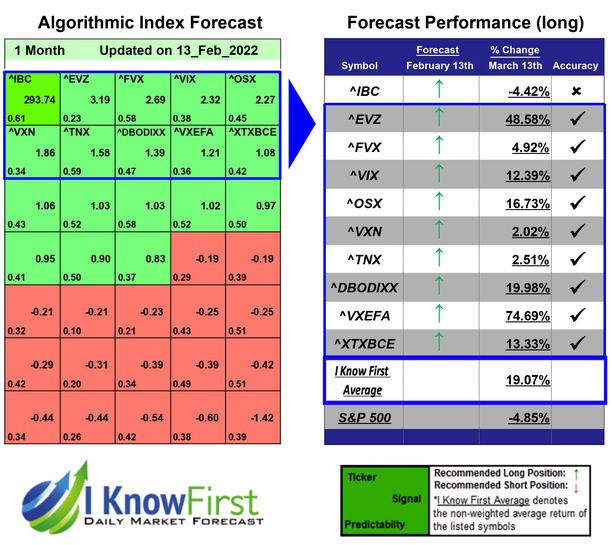
I Know First has developed the Indices Forecast Package to help our client to determine the most promising investment areas. This Indices Forecast Package had correctly predicted 9 out of 10 stock movements. VXEFA was the highest-earning trade with a return of 74.69% in 1 Month. EVZ and DBODIXX saw outstanding returns of 48.58% and 19.98%. The package’s overall average return was19.07%, providing investors with a 23.92% premium over the S&P 500’s return of 4.85% during the same period.

To subscribe today click here.
To learn more about I Know First and the solutions we offer, visit our website


