The Future Of Risk Management Part 2: Quantifying Uncertainty

This article was written by Julia Masch, a Financial Analyst at I Know First.
Click here to read The Future of Risk Management Part 1: Forecasting Liquidity
Highlights
- Understanding Uncertainty
- Bayesian Updating & Algorithmic Advantages
- In the Pipeline: Quantifying Uncertainty
Understanding Uncertainty
Chaotic systems such as the stock market have risk and uncertainty inherently associated with them. Even though we can predict these systems, because of the massive amounts of random events that can potentially occur, it is almost impossible to be 100% accurate. However, it is possible to quantify uncertainty and use these numerical values to minimize risk.
![]()
![]()
(Source: Wikimedia Commons)
There are many different sources of uncertainty that can affect a model. Parameter uncertainty and variability results from the fact that variables are not truly known, and while a model can run multiple scenarios for differing values, the true value is unclear until the time allotted ends at which point it is too late to run more calculations. Another source is structural uncertainty which comes from the fact that most models are only approximations to reality, and therefore, the accuracy of prediction is only as good as the model itself.
Sensitivity Analysis
To quantify uncertainty one has to evaluate the effect of different variables affecting the stock value. As an example, let’s look at the fundamental valuation of a company’s worth – Net Present Value (NPV) using the discounted cash flow model. To do this, analysts often try to quantify the sensitivity of Net Present Value (NPV) in response to a change in input. Net Present Value is a measurement of profit calculated by subtracting the present values of cash outflow from cash inflow for an investment.
Most often the factors one looks at when figuring out sensitivity are the same as the inputs for discounted cash flow (DCF) model such as discount rate and cash flow. Analysts can perform a sensitivity analysis by changing one variable while keep all others constant, then the sensitivity becomes the equivalent of the change in net present value divided by the change in the input, or the slope.
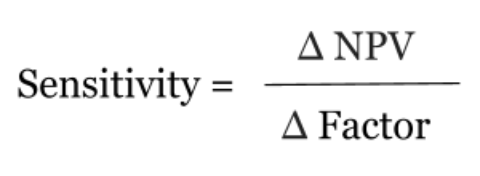
Sensitivity analysis is the process of recalculating different outcomes based on changes to inputs in order to determine the total change. One of the most common ways this kind of sensitivity analysis can be utilized is by determining NPV at various growth rates in annual revenue such as a worst case revenue of -10%, a likely case revenue of 0%, best case revenue of 15%, etc.. Thus, using the formula, sensitivity can be calculated, and it is possible to understand the impact a change in a singular factor affects the total revenue. In more complex cases, analysts may want to see the effects of a change in multiple factors, which may occur in the case when a change in one factor affects another. These factors can be either localized to the company or can be attributed to global factors such as interest rate. In this case, a scenario-based forecast of NPV can be created with respective changes in multiple inputs. This result can then be compared to the original to see how various scenarios fare.
Using sensitivity analysis has many benefits. By comparing the various scenarios, one can form an increased understanding of the relationships between the inputs and outputs. Alternatively, one can contrast the differing scenarios to minimize uncertainty by identifying the inputs that cause the greatest effect on output and focusing attention on these.
Bayesian updating
Another way to simulate the most likely outcome is to use probability weighted average. If one knows the likelihood of specific situations occurring, an algorithm can run all of these various scenarios and then weigh them based of the probability of that specific event occurring, in a process akin to Bayesian updating. Bayesian updating is particularly important in the dynamic analysis of data when the latest events are being continuously added to the previously known data. This then gives an output that does not reflect the most likely outcome, but the mean outcome, or alternatively, assigns a probability to different outcomes. This way one can account for all the possibilities and understand how the given probabilities of certain events, relate to each other and see the expected value of all scenarios.

(Source: Wikipedia)
Algorithmic Advantages
While it is helpful to create individual scenarios, it does not account for the potential randomness inherent in the processes that take place in the stock market. In order to account for this, one can utilize the Monte Carlo method which tests a large amount of scenarios changing various randomly to mimic the fickleness of reality. Thanks to increased processing power from better chips, it is now possible to use algorithms to run countless scenarios and be prepared for almost anything.
Another way to obtain the best possible output and further improve the results from the Monte Carlo method is to use temporal difference learning. In this procedure, machine learning is used to create a dynamic value of NPV unlike the Monte Carlo method which only adjusts estimates once the outcome is produced and analyzed. This algorithm uses bootstrapping and adapts to create an ideal final outcome instead of a myriad of potential outcomes. Another more advanced form of the Monte Carlo method is the Morris method, also known as a one-step-at-a-time (OAT) method. In every run, only one input parameter is changed. This way a large number of local changes occurs at different points in the algorithm.
Alternatively, one can also use genetic algorithms in order to optimize the outcome. This type of algorithm creates randomly assigned inputs, ranks them according to quality of outputs, and then combines the best ones, and then redoes the process using the better inputs in order to find the ideal inputs for an optimal output.
In comparison, the method of accounting for these situations used to be scenario planning. The process of scenario planning begins by first identifying the factors that will contribute to output, then creating relationships between these drivers. Once a model is created, then 7-10 mini scenarios are produced from which 2-3 main scenarios are compiled. From these, one will identify the arising issues and plan based on only these situations. There is clearly a disadvantage to this type of planning as it accounts for only a fraction of the outcomes an algorithm will have considered.

In the Pipeline: Using I Know First Algorithm To Quantify and Forecast Uncertainty
Currently, I Know First is in the process of forecasting ‘what if’ scenarios. Using the stock market data available to the public, the algorithm can identify the larger trends in the stock market and reduce uncertainty regarding the future value of individual companies. Running different scenarios will allow the subscriber to see possible outcomes and minimize risk within their portfolio.
Part 1: Forecasting Liquidity
More About I Know First