This stock market forecast article was written by Sergey Okun – Senior Financial Analyst at I Know First, Ph.D. in Economics.
Highlights
A correctly identified market anomaly can generate a profit for an investor, allowing them to beat the market.
We have tested the January Barometer and found that exploring this anomaly can provide some insight into future returns.
The I Know First AI algorithm can identify working market anomalies that could be difficult for an ordinary investor to recognize.
(tradersunion.com)
Any investor is interested in finding a strategy that allows them to extract additional returns without taking a corresponding level of risk. A market anomaly is a change in the price or return of a security that cannot be directly linked to current relevant information available in the market or to the release of new information into the market. It is a stock behavior that is systematically repeated from one period to another using which an investor can use to generate a positive return, and where the market efficiency concept does not work. Anomalies can appear, disappear, and reappear with almost no warning. Moreover, before exploiting a market anomaly, a researcher should find supporting evidence that the market anomaly is consistent over reasonably long periods. Otherwise, a detected market anomaly may largely be an artifact of the sample period chosen. Also, when wishing to detect a profitable anomaly, a researcher can fall into the pitfall of data snooping.
Previously, we tested the January anomaly, whereby stock market returns tend to be higher in January than in other months of the year. Here, we will test the January Barometer anomaly, which posits that January’s return can predict the stock market’s performance for the rest of the year. We test this market anomaly using monthly S&P500 returns from 1971 to 2025.
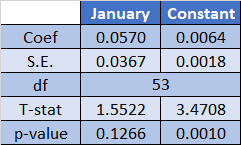
First, we examine what return for the rest of the year can be expected based on January’s realized return.
*Coef – the coefficient of regression and the constant, respectively **S.E. – Standard error ***df – Degree of freedom
Based on the market anomaly test above, we observe that if the return in January is zero, we expect an average monthly return for the rest of the year to be around 0.0064%. Furthermore, each additional percentage point of return in January generates, on average, an additional 0.0570% in the average monthly return for the subsequent months. Therefore, if the return in January is 10%, the average monthly return for the rest of the year would be approximately 0.58%. Conversely, if the return in January is -10%, the average monthly return for the rest of the year would also be negative, at approximately -0.56%. However, the p-value for the January coefficient is approximately 0.1266, which means we cannot reject the null hypothesis (that January’s return has no effect) at the 10% significance level.
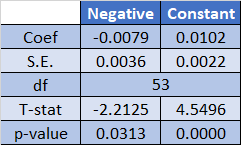
Next, let’s examine the expected average monthly return for the rest of the year, conditional on January’s return being positive or negative.
*Coef – the coefficient of regression and the constant, respectively **S.E. – Standard error ***df – Degree of freedom
According to the test above, we can conclude that if the return in January is negative, then we should expect an average monthly return of around 0.0024%. If the return in January is positive, then we should expect an average monthly return of around 0.0102%. Moreover, both coefficients are statistically significant at the 5% level, which allows us to accept the hypothesis about the existence of the January Barometer effect.
Exploit Market Anomalies with I Know First
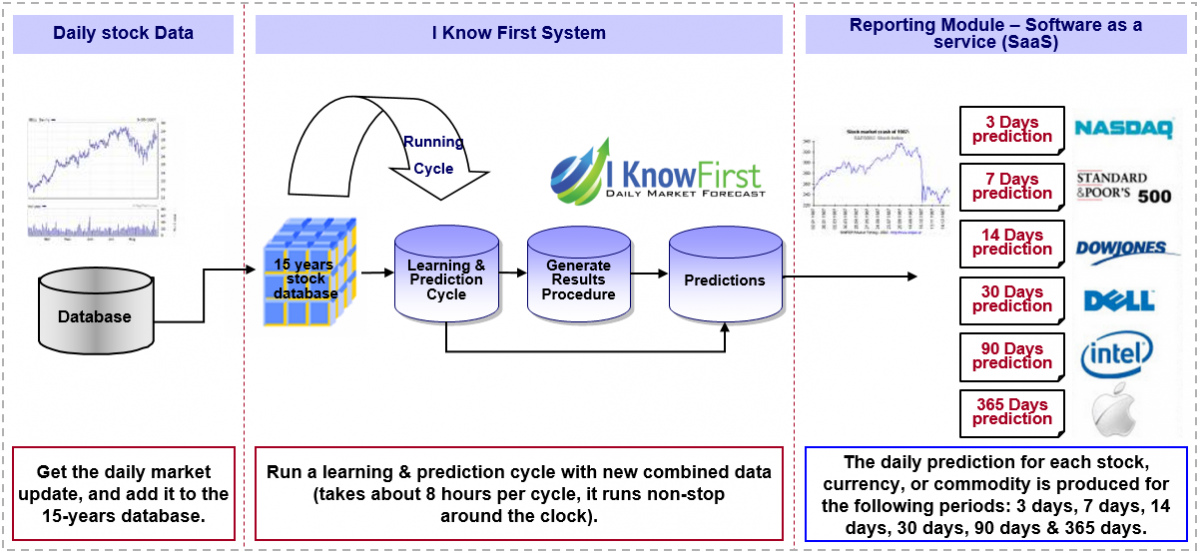
A correctly identified market anomaly can generate a profit for an investor that enables him to beat the market. However, recognizing a working anomaly is a challenging task where a mistake can cost money. AI can identify a working market anomaly that could be difficult for an ordinary investor to recognize. The I Know First predictive algorithm is a successful attempt to discover the rules of the market that enable us to make accurate stock market forecasts. Taking advantage of artificial intelligence and machine learning and using insights of chaos theory and self-similarity (the fractals), the algorithmic system is able to predict the behavior of over 13,500 markets. The key principle of the algorithm lays in the fact that a stock’s price is a function of many factors interacting non-linearly. Therefore, it is advantageous to use elements of artificial neural networks and genetic algorithms. How does it work? At first, an analysis of inputs is performed, ranking them according to their significance in predicting the target stock price. Then multiple models are created and tested utilizing 15 years of historical data. Only the best-performing models are kept while the rest are rejected. Models are refined every day, as new data becomes available. As the algorithm is purely empirical and self-learning, there is no human bias in the models and the market forecast system adapts to the new reality every day while still following general historical rules.
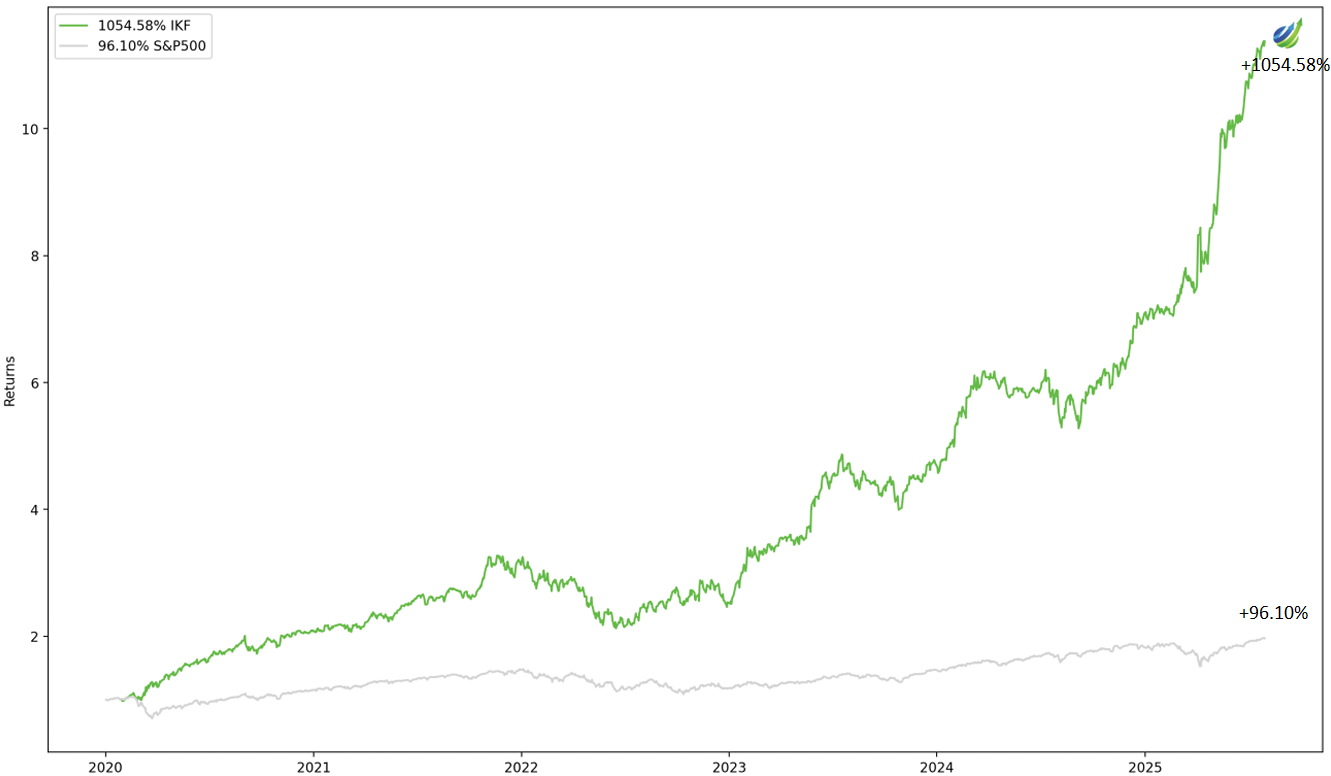
I Know First has used algorithmic outputs to provide an investment strategy for institutional investors. Below you can see the investment result of our Magnificent Seven Multi-Tier AI investment strategy. The trading strategy was developed using I Know First’s AI Algorithm daily forecasts from January 1st, 2020, to July 31st, 2025. This strategy is available to our institutional clients: hedge funds, banks, and investment houses, as a tier 2 service on top of tier 1 (the daily forecast).
The strategy provides a positive return of 1054.58% which exceeded the S&P 500 return by 958.48%.
Stock Market Forecast: Conclusion
Any investor is interested in finding a strategy that allows them to extract additional returns without taking a corresponding level of risk. Here, we have tested the January Barometer effect and found that exploration of this anomaly can provide some guidance about future returns. A correctly identified market anomaly can generate a profit for an investor, allowing them to beat the market. However, recognizing a viable anomaly is a challenging task where a mistake can be costly. The I Know First AI algorithm can identify such viable market anomalies that would be difficult for an ordinary investor to recognize.
I Know First-Daily Market Forecast, does not provide personal investment or financial advice to individuals, or act as personal financial, legal, or institutional investment advisors, or individually advocate the purchase or sale of any security or investment or the use of any particular financial strategy. All investing, stock forecasts and investment strategies include the risk of loss for some or even all of your capital. Before pursuing any financial strategies discussed on this website, you should always consult with a licensed financial advisor.