
Market Anomaly: January and April Effects
 This article “Market anomaly: January and April effects” was written by Sergey Okun – Senior Financial Analyst at I Know First, Ph.D. in Economics.
Highlights
- A correctly identified market anomaly can generate a profit for an investor that enables them to beat the market.
- We have tested the January and April effect anomalies and we have found that exploration of this anomaly cannot provide the desired return for an investor today.
- The I Know First AI algorithm can identify working market anomalies that could be difficult for an ordinary investor to recognize.

Any investor is interested in finding a strategy that allows him to extract additional returns without taking a corresponding grade of risk. Market Anomaly is a change in the price or return of a security that cannot be directly linked to current relevant information available in the market or to the release of new information into the market. It is a stock behavior that is systemically repeated from one period to another using which an investor can generate a positive return, and where the market efficiency concept does not work. Anomalies can appear, disappear, and reappear with almost no warning. Moreover, before exploiting a market anomaly, a researcher should find supporting evidence that the market anomaly is consistent over reasonably long periods. Otherwise, a detected market anomaly may largely be an artifact of the sample period chosen. Also, wishing to detect a profitable anomaly, a researcher can pitfall in the process of data snooping.
Anomalies can appear, disappear, and reappear with almost no warning. Moreover, before exploiting a market anomaly, a researcher should find supporting evidence that the market anomaly is consistent over reasonably long periods. Otherwise, a detected market anomaly may largely be an artifact of the sample period chosen. Also, wishing to detect a profitable anomaly a researcher can pitfall in the process of data snooping. Data snooping is the practice of determining a model by extensive searching through a dataset for statistically significant patterns. In general, an initial hypothesis is developed which is based on economic rationale. Tests are then conducted on objectively selected data to either confirm or reject the original hypothesis. However, with data snooping, the process is typically reversed: data are examined with the intent to develop a hypothesis, instead of developing a hypothesis first. This is done by analyzing data in various manners and even utilizing different empirical approaches until you find support for the desired result, in this case, a profitable anomaly. Enough data snooping often can detect a trading strategy that would have worked in the past by chance alone. But in an efficient market, such a strategy is unlikely to generate abnormal returns on a consistent basis in the future.
Here, we test January and April anomalies. The January effect is a tendency for increases in stock prices during the beginning of the year, particularly in the month of January. The increase in demand for stocks is often preceded by a decrease in price during the month of December, often due to tax-loss harvesting. An alternative reason for the rise in demand is the effect of year-end bonuses individuals receive that are invested in the market. The January Effect may also be driven by consumer sentiment. As January is the beginning of a new year, many investors believe that the start of the year is the best time to begin investing for their future, under a clean slate.

The April effect is a tendency for increases in stock prices in April. The S&P 500 has closed positive in April in 15 of the last 16 years, according to LPL Financial, and April is routinely celebrated as one of the best months of the year for stocks. There are could be several explanations for this anomaly’s existence. One theory is that investors are spending their tax refunds to buy stocks, pushing share prices higher. Another potential reason is that institutional investors may be cleaning up their portfolios in March by removing some underperforming stocks, since they need to report quarterly to shareholders and the first quarter ends at the end of March. Then in April, those investors may have some cash on the sidelines and buy back in.
We test January and April effects by the t-test of unequal variances.

(Figure 2: The t-test of Unequal Variances)
Let’s analyze the existence of January and April effects in the S&P500 returns for the recent 5-year period from December 27th, 2017 to December 23rd, 2022.


According to Figures 3 and 4, we can notice that daily January and April means are around 0.0671% and 0.1261% while the Other days’ mean is around 0.0356% for the test of the January effect and around 0.0302% for the test of the April effect. Therefore, we can notice that average daily returns in January and in April are higher than in other months, which, at the first glance, supports the existence of these two anomalies.
The unequal variance t-test allows us to test the equality of variances, to identify whether daily returns in January and April are different from the daily return in Other months. Firstly, we calculate the difference between the January day’s mean and the Other months day’s mean, and between April’s day’s mean and the Other months day’s mean which are 0.0315% and 0.0959% respectively. We can notice that in both cases daily returns in January and April are higher than in Other months. Figure 2 enables us to calculate the daily standard deviation for the t-tests which are 0.1423% for January and 0.1410% for April. Therefore, we can calculate the t-stats for January and April, which are 0.22 and 0.68 respectively. Consequently, p-values for January and April are equal to 82.49% and 49.67% respectively, which means that we cannot reject the null hypothesis about the absence of January or April effects. Therefore, we have not found statistical support that January and April’s effects have worked for the last 5 years.
Let’s check for an even longer period to validate our findings. Below in Figure 4, we can notice our estimation to identify January and April effects for the period of January 4th, 2000, to December 23rd, 2022.


According to Figures 5 and 6, we can notice that the daily January mean is around -0.0228% while the daily April’s mean is 0.0934%. The negative daily mean return in January goes into controversy with the idea that the stock market outperforms in January. Also, the hypothesis that the stock market underperforms in January and April is not verified by the statistical test. The p-values for January and April are equal to 39.35% and 21.12% respectively, which means that we cannot reject the null hypothesis about the absence of these two effects.
Below, we can notice the statistical result of identifying the weekend effect from January 3rd, 1928, to December 23rd, 2022.
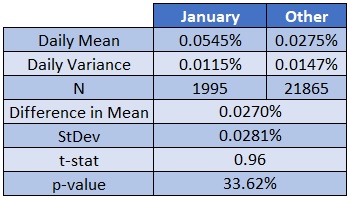

According to Figures 7 and 8, we can notice that daily January and April means are around 0.0545% and 0.0627% which is higher than the daily mean of Other months, respectively. The p-values for January and April are equal to 33.62% and 20.45% respectively, which means that we cannot reject the null hypothesis about the absence of these two effects. Does it mean, according to our results, that January and April effects have never existed? The answer is no. It is possible that if we check certain decades of the 60s, the 70s, or the 80s, and so on, we could identify these effects in the stock market, but we could not consider these effects in making investment decisions today.
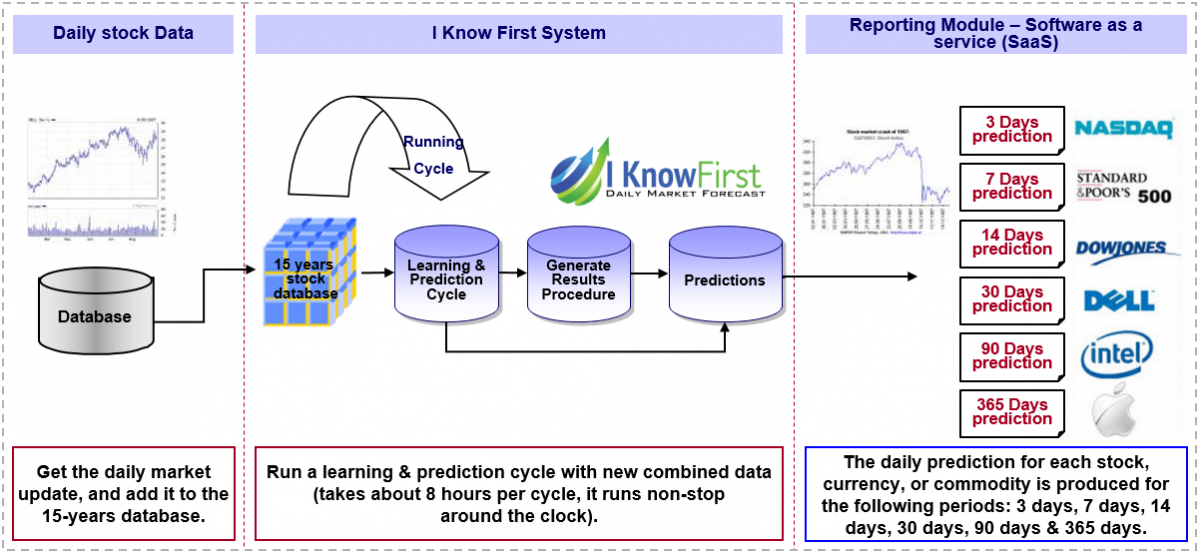
Exploit Market Anomalies with I Know First
A correctly identified market anomaly can generate a profit for an investor that enables him to beat the market. However, recognizing a working anomaly is a challenging task where a mistake can cost money. AI can identify a working market anomaly that could be difficult for an ordinary investor to recognize. The I Know First predictive algorithm is a successful attempt to discover the rules of the market that enable us to make accurate stock market forecasts. Taking advantage of artificial intelligence and machine learning and using insights of chaos theory and self-similarity (the fractals), the algorithmic system is able to predict the behavior of over 13,500 markets. The key principle of the algorithm lays in the fact that a stock’s price is a function of many factors interacting non-linearly. Therefore, it is advantageous to use elements of artificial neural networks and genetic algorithms. How does it work? At first, an analysis of inputs is performed, ranking them according to their significance in predicting the target stock price. Then multiple models are created and tested utilizing 15 years of historical data. Only the best-performing models are kept while the rest are rejected. Models are refined every day, as new data becomes available. As the algorithm is purely empirical and self-learning, there is no human bias in the models and the market forecast system adapts to the new reality every day while still following general historical rules.
I Know First has used algorithmic outputs to provide an investment strategy for institutional investors. Below you can see the investment result of our S&P 500 Stocks package which was recommended to our clients for the period from January 1st, 2020 to December 28th, 2022 (you can access our forecast packages here).

The investment strategy that was recommended by I Know First accumulated a return of 52.88%, which exceeded the S&P 500 return by 34.36%.
Conclusion
Any investor is interested in finding a strategy that allows him to extract additional returns without taking a corresponding grade of risk. Here, we have tested the January and April anomalies and we see that exploration of this anomaly cannot provide the desired return for an investor today. A correctly identified market anomaly can generate a profit for an investor that enables them to beat the market. However, recognizing a working anomaly is a challenging task where a mistake can cost money. The I Know First AI algorithm can identify working market anomalies that could be difficult for an ordinary investor to recognize.

To subscribe today click here.
Please note-for trading decisions use the most recent forecast.


