
Herding Behavior on the Stock Market
 This article “Herding Behavior in the Stock Market” was written by Sergey Okun – Senior Financial Analyst at I Know First, Ph.D. in Economics.

Highlights
- Herding behavior refers to the tendency of individuals to follow the actions or decisions of a larger group of people, rather than making independent decisions.
- The CSAD model enables us to identify periods of herding behavior on the stock market.
- We implement the CSAD model and identify cases of herding behavior on the stock market for the period from January 1st, 2020 to April 19th, 2023.
The investment process deals with uncertainty that creates an uncomfortable feeling for investors causing doubts about choosing the right investment asset and fear of losing money. Everyone wants to beat the market, which means making investment decisions based on a point of view that is different from the point of view of an average investor, or from a generally accepted view of the market at the current time. However, the idea to go against conventional wisdom creates a fear of incurring losses when all others make a profit (staying in the situation to be the silliest one among the people around), which provides greater harm to investor psychology than a situation where an investor has losses when all others have losses. Thus, investors have greater stimulus to stay with the crowd which creates herding behavior on the stock market.
Herding behavior refers to the tendency of individuals to follow the actions or decisions of a larger group of people, rather than making independent decisions. In the context of the stock market, herding behavior can lead to investors buying or selling stocks based on the actions of others, rather than on their own analysis of the underlying fundamentals of the companies they are investing in. This can sometimes lead to irrational and exaggerated price movements in the stock market, as investors all rush to buy or sell at the same time, based on the actions of others, rather than on their own analysis of market conditions. Examples of herding behavior include: momentum trading, panic selling, social proof, analyst recommendations, investment fads, and others.
In our article: Space of Chaos on the Stock Market, we investigated the behavior of the S&P500 in the context of predictability for 2019-2022 and determined the number of factors that were considered by investors in different periods of time. In the current article, we try to find evidence of herding behavior on the stock market. To determine herding behavior we implement the cross-sectional absolute deviation of returns regression model (CSAD):

(Figure 1: The cross-sectional absolute deviation of returns regression model)
For identifying herding behavior using the CSAD model, we are interested in the value of the regression coefficient b3 that relates cross-sectional absolute deviation to squared market return (b3r2m). This coefficient checks for the non-linear dynamics of herding behavior. If herding behavior is present, we expect this coefficient to be negative and significant. At the same time, absolute market return in the model demonstrates whether the spread of stock returns increases or decreases with greater market movements in any direction (either positive or negative) and therefore serves as an indicator of herding. We take the returns for SPY as the independent variable for the period t, and the average returns of SPDR ETFs (XLF, XLI, XLK, XLV, XLB, XLP, XLU, XLE, XLY) as the dependent variable (CSAD) for the period of t.
Let’s first analyze the existence of herding behavior at the end of the first COVID year on December 31, 2020.

For checking the existence of herding behavior, we pay attention to the regression coefficient for the squared market return variable, which should be negative and statistically significant in the case of herding behavior. In Figure 1, we can notice that the Squared Market Return has a negative regression coefficient of -0.8770 and p-value of 1.07%, which means that the coefficient is statistically significant. To sum up, we have found evidence of existing herding behavior on the stock market for the period of 03.01.2019-31.12.2020.
Figure 2 presents an estimation for the CSAD model with a rolling window of 504 trading days from December 31st, 2019, to April 19th, 2023. The estimation output in Figure 2 takes two numbers: 1 – when the regression coefficient for the squared market return variable is negative and statistically significant, and 0 – in other ways.
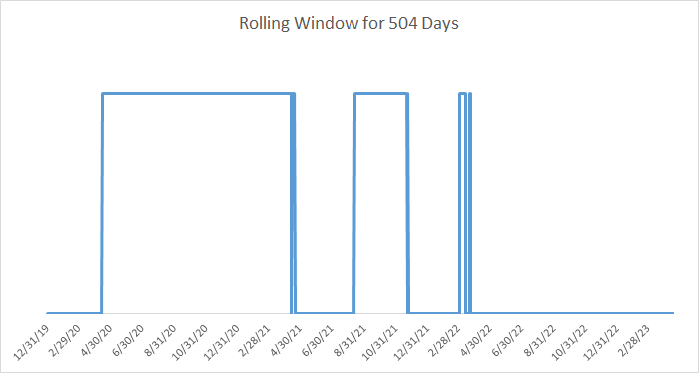
According to Figure 2, we can notice several periods of herding behavior. The longest one is from 15th April 2020 to 14th April 2021. We also identify cases of herding behavior on April 16th, 2021 – April 20th, 2021; August 13th, 2021 – November 22nd, 2021; March 4th, 2022 – March 14th, 2022; March 23rd, 2022 – March 24th, 2022. I suppose that most cases of herding behavior in the analysis period could be explained by the impact of COVID-19 on the economic system and, following this, monetary policy measures to support the economy.
What Does I Know First Put on the Table?
Statistical methods can provide different results depending on the number of observations and data frequency. In our case, we identified cases of herding behavior based on 504 daily trading data observations. If we used a different number of observations, we could get different periods of herding behavior. However, in any case, we would most likely come to the same conclusion about the existence of herding behavior on the stock market for the period from December 31st, 2019 to April 19th, 2023. Another way to analyze stock market data is based on chaos theory approaches which we implemented and discussed in our previous articles: Space of Chaos on the Stock Market, and the Conceptual Framework of Applying ML and AI Models to Analyze and Forecast Financial Assets (and others articles which can be found here). Moreover, applying artificial intelligence algorithms can help capture cases of herding behavior in real-time to find the most recent investment opportunities.
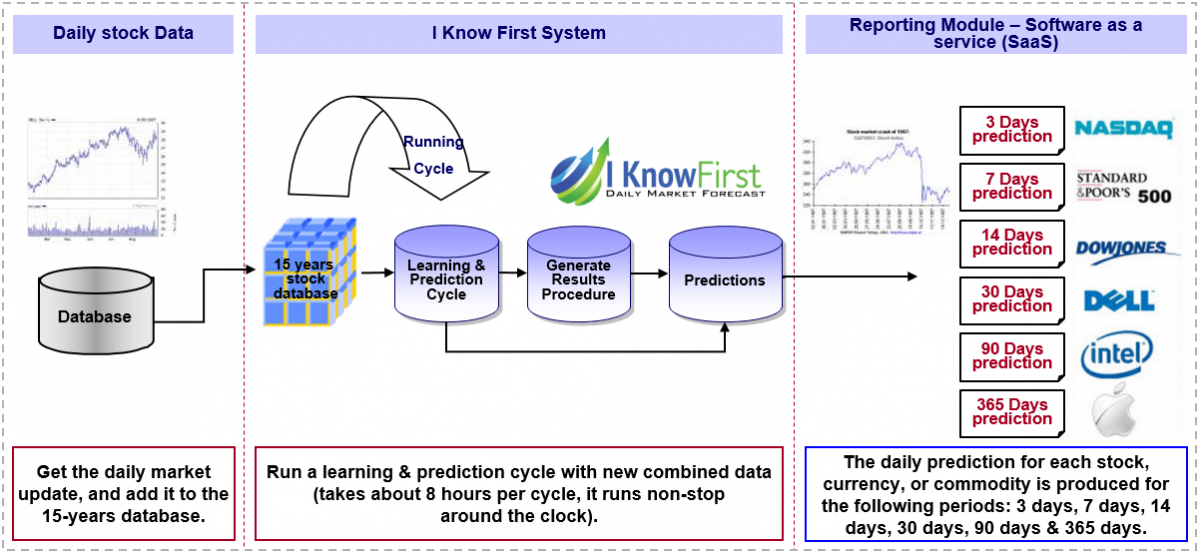
The I Know First predictive algorithm is a successful attempt to discover the rules of the market that enable us to make accurate stock market forecasts. Taking advantage of artificial intelligence and machine learning and using insights of chaos theory and self-similarity (the fractals), the algorithmic system is able to predict the behavior of over 13,500 markets. The key principle of the algorithm lays in the fact that a stock’s price is a function of many factors interacting non-linearly. Therefore, it is advantageous to use elements of artificial neural networks and genetic algorithms. How does it work? At first, an analysis of inputs is performed, ranking them according to their significance in predicting the target stock price. Then multiple models are created and tested utilizing 15 years of historical data. Only the best-performing models are kept while the rest are rejected. Models are refined every day, as new data becomes available. As the algorithm is purely empirical and self-learning, there is no human bias in the models and the market forecast system adapts to the new reality every day while still following general historical rules.
I Know First has used algorithmic outputs to provide an investment strategy for institutional investors. Below you can see the investment result of our S&P 500 Stocks package which was recommended to our clients for the period from January 1st, 2020 to March April 19th, 2023 (you can access our forecast packages here).

The investment strategy that was recommended by I Know First accumulated a return of 80.29%, which exceeded the S&P 500 return by 51.69%.
Conclusion
Herding behavior refers to the tendency of individuals to follow the actions or decisions of a larger group of people, rather than making independent decisions. We implemented the CSAD model and identified cases of herding behavior on the stock market for the period from January 1st, 2020 to April 19th, 2023. Herding behavior can lead to irrational and exaggerated price movements on the stock market, as investors all rush to buy or sell at the same time, based on the actions of others, rather than on their own analysis of market conditions. Applying artificial intelligence algorithms can help capture cases of herding behavior in real-time to find the most recent investment opportunities.

To subscribe today click here.
Please note-for trading decisions use the most recent forecast.


