
Space of Chaos on the Stock Market
 This article “Space of Chaos in the Stock Market” was written by Sergey Okun – Senior Financial Analyst at I Know First, Ph.D. in Economics.
Highlights:
- The S&P 500 demonstrates a consistent long-term memory that enables us to implement machine learning methods for prediction purposes.
- The S&P 500 has become more predictable since Covid-19 introduced itself in 2020.
- Investors have begun to consider fewer factors than they did before 2020.

Long-Term Memory
Covid-19 and government economy stimulations were the main topics in 2020 and 2021. Inflation, as a consequence of government economic policy in previous years, and measures to fight inflation have captured investment thinking in 2022. The financial market is a complex system of investment expectations and its behavior depends on various factors which could be difficult to identify and predict. When Covid-19 introduced itself in 2020 it had the Black Swan effect which dramatically changed the rules of the game and created a new investment reality. From a classical point of view, we consider the capital market system as being in equilibrium as long as it is not perturbed by exogenous influences. Thus, there is a natural balance between supply and demand until some event affects one or the other, forcing the system to seek a new equilibrium position. At the same time in the nonlinear dynamic systems, randomness and determinism coexist and together create a statistical order (an example of such statistical order is a fractal).
In our previous article, we estimated the long-term memory for the S&P 500, the DAX 30, the CAC 40, and the FTSE 100 indices that enables us to make market predictions based on the Theory of Chaos (here we describe aspects of the Chaos Theory to analyze financial markets). In this article, we want to identify how Covid-19 and government economic policy have been influencing the behavior of the stock market in the context of predictability and uncertainty since 2020.
The Hurts exponent allows us to identify the effect of long-term memory on market returns series. When the Hurts exponent is different from 0.5, it means that observations are not independent. Each observation contains a memory of past events. Moreover, this memory is not a short-term memory or Markov’s memory. It is long-term memory that, theoretically, can be stored forever. Recent events have a greater influence on stock prices today than distant events have, but the residual influence of distant events is always palpable. The Hurst exponent value (H) lies within the interval 0 < H < 1. Depending on which part of the interval the estimated value appears in, we can judge the memory of the market index. There are three possible cases to consider:
- If 0 ≤ H < 0.5, then a time series is characterized as mean-reverting.
- if H = 0.5, then there is a completely uncorrelated time series with normal distribution. Stock returns are random, which is an example of Brownian motion.
- if 0.5 < H ≤ 1, then a time series has positive autocorrelation and clusters in one direction (there is a persistent component). The closer the H value is to 1, the more predictable a time series is.
The persistent time series defined as 0.5<H≤1 is a fractal because it can be described as a generalized Brownian motion. In generalized Brownian motion, there is a correlation between events on the time scale. We analyze the dynamics of the Long-Term Memory feature of the S&P 500 daily returns by the Hurst exponent until September 9, 2022. The Hurst exponent is calculated with the rolling window of 4 years (1024 data points of the S&P 500 daily returns).
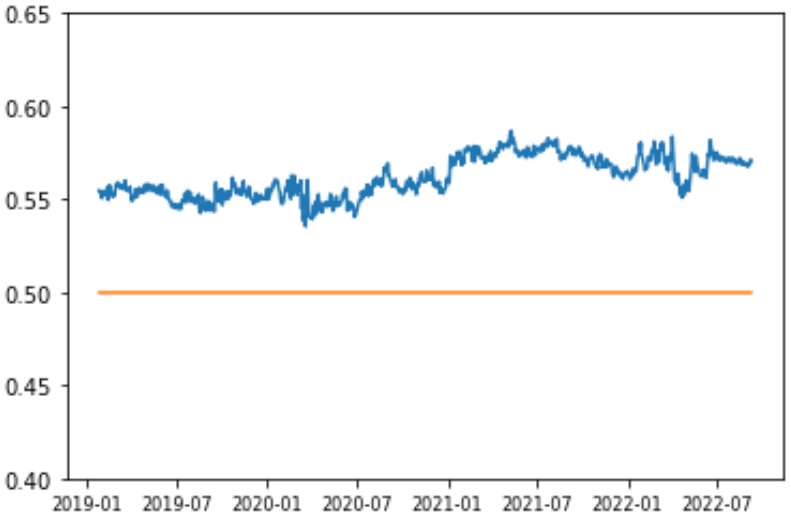
The Hurst exponent is equal to 0.571 on September 9th, 2022. Overall we can notice that the Hurst exponent of the S&P 500 daily returns is consistent for the analysis period with a range from 0.535 to 0.587. At the same time, we can see that there was a turbulence period for the H parameter at the beginning of 2020. After that H showed a positive trend. Moreover, we can state that H has had a greater value after Covid-19 introduced itself than before, which means increasing predictability of the stock market.
Below we can notice a T-statistic and its critical values of the Hurst exponent for the analyzing period of time. According to Figure 2, we can see that it is always at least close to the positive critical value at around 3.5 (critical values are chosen at 0.005 and 0.995). Overall, we can conclude that the Hurst exponent is estimated in a reliably persistent way.
The reason for the turbulence of H at the beginning of 2020, as shown in Figure 1, can be explained by the beginning of the pandemic, which has a shock effect on the system as a whole. But after that, the H parameter showed positive dynamics, which means that the stock market was becoming more and more predictable. I think the situation, with the rise of the H parameter and its current level higher than it was before the pandemic, can be explained by the existence of some factor or a group of factors that investors have begun to consider more in making investment decisions. I suppose with great confidence that we can identify the government’s economic support in 2020 – 2021 and the following economic measures against inflation as the main factors which have been determining the stock market dynamic for the analyzed period of time (in more detail, we describe the stock market dynamic in the pandemic time here). Therefore, the anticipation of the Fed’s actions has become a major factor in investment decisions that has increased the predictability of the S&P 500, because everyone has been looking at the Fed. Although the Fed’s activity is the obvious factor, that determines the stock market dynamic, can we say that it is only one factor or there are a number of factors which have been considered when making investment decisions?
Phase Dimension
Many chaotic systems have an infinite number of possible solutions contained in a limited part of space which has a phase dimension. The phase dimension of a system enables us to determine the size of the space of factors which have an impact on the system. The dimension of the phase space depends on the number of variables in the system. If it includes two or three variables, we can observe the data visually. The phase space includes all variables of the system and its dimension depends on the complexity of the system under study.

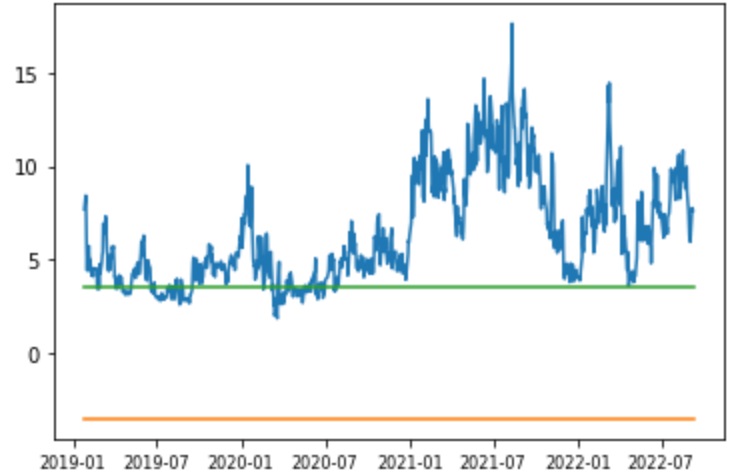
In Figure 3 we can notice the size of the phase dimension of the S&P 500 daily returns in different periods of time from January 2016 to August 2022. Each point is calculated for the period of three years (around 753 data points) with a one-month rolling window. I use periods of 3 years based on the following: 1. we need enough data to correctly estimate the phase dimension; 2. the sample size should not be too large so that we can identify features of the functioning of the system and its changes in certain periods of time. Currently, we do not have enough data covering only the period after February 2020 that would enable us to divide the data set into two subsets before and after the pandemic. For example, we estimate the phase dimension of 12 for the period from December 1, 2017, to November 30, 2020. The problem is that the phase dimension estimation of 12 during this period of time can be not precise enough because the system was in two different states with different sets of factors which were considered by investors. On the other hand, it can give us some insight into the behavior of the system in the transformation stage.
Nevertheless, we can state that the phase dimension, before the pandemic began, was equal to 10 at the end of February 2020 (the estimation window from March 1st, 2017 to February 28, 2020) and it is a consistent number of phase dimensions for the previous 10 estimated windows. Also, we notice that the dimension phase size decreased to 5 for the period from September 3rd, 2019 to August 31st, 2022, and I suppose, we can consider that, investors have been considering 5 factors in making investment decisions after February 2020. It will be interesting to see the phase dimension when we have enough data to cover only the period after February 2020, but despite this, we can stick to the phase dimension estimation of 5. Moreover, according to Figure 3, we can notice that the estimation of 5 is consistent for 11 periods in a row.
Therefore, decreasing the phase dimension size means that investors have begun to consider fewer factors that have decreased the degree of freedom in the system and have increased the predictability of the stock market which goes in line with our analysis by the Hurst exponent. At the same time paying attention to a limited number of factors increases the probability of high turbulence periods because an impact of a single factor increases when the total number of factors decreases. For example, we can see that usually, the stock market volatility is high around the FOMC meeting in 2022.
What Does I Know First Put on the Table?
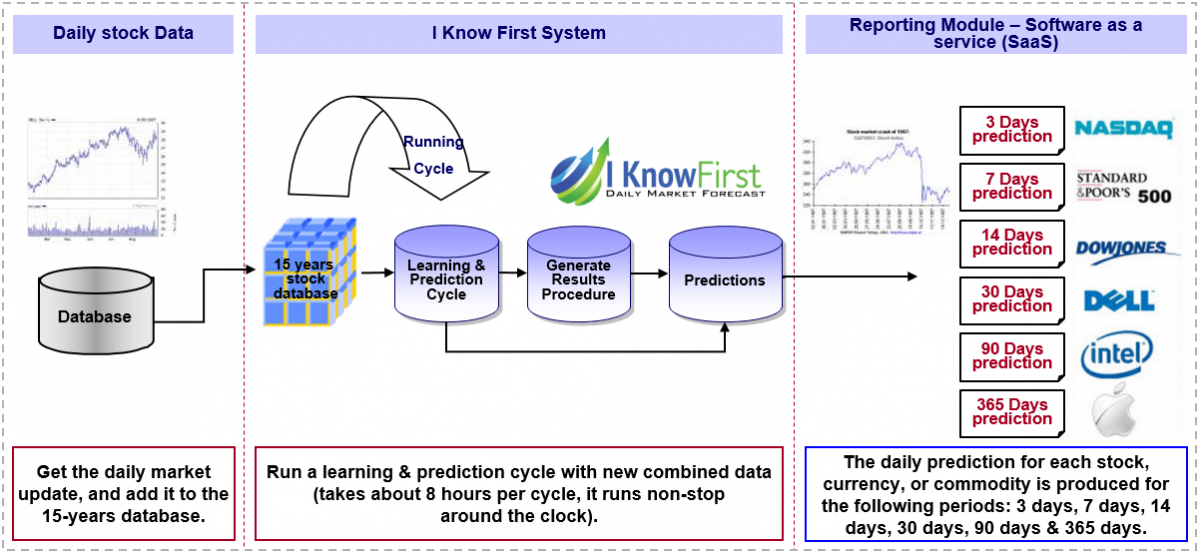
I Know First provides stock market forecasts based on chaos theory approaches. Previously, we discussed the Conceptual Framework of Applying ML and AI Models to Analyze and Forecast Financial Assets. The I Know First predictive algorithm is a successful attempt to discover the rules of the market that enable us to make accurate stock market forecasts. Taking advantage of artificial intelligence and machine learning and using insights of chaos theory and self-similarity (the fractals), the algorithmic system is able to predict the behavior of over 13,500 markets. The key principle of the algorithm lays in the fact that a stock’s price is a function of many factors interacting non-linearly. Therefore, it is advantageous to use elements of artificial neural networks and genetic algorithms. How does it work? At first, an analysis of inputs is performed, ranking them according to their significance in predicting the target stock price. Then multiple models are created and tested utilizing 15 years of historical data. Only the best-performing models are kept while the rest are rejected. Models are refined every day, as new data becomes available. As the algorithm is purely empirical and self-learning, there is no human bias in the models and the market forecast system adapts to the new reality every day while still following general historical rules.
I Know First has used algorithmic outputs to provide an investment strategy for institutional investors. Below you can see the investment result of our S&P 500 Stocks package which was recommended to our clients for the period from January 1st, 2020 to September 14th, 2022 (you can access our forecast packages here).

The investment strategy that was recommended by I Know First accumulated a return of 96.17%, which exceeded the S&P 500 return by 74.44%.
Conclusion
The financial market is a complex system that can be analyzed by methods based on the theory of chaos. The S&P 500 demonstrates a consistent long-term memory that enables us to implement machine learning methods for prediction purposes. Moreover, according to the Hurst exponent, the S&P 500 has become more predictable since Covid-19 introduced itself in 2020. Furthermore, we evaluate the complexity of the stock market as a system based on phase dimension, and we can state that investors have begun to consider fewer factors than they did before 2020.

To subscribe today click here.
Please note-for trading decisions use the most recent forecast.


