Day Trading Strategy: An In-depth Analysis of Realistic Back-Tests
slippage, price impact, commissions, back-test, day trading

 Daniel Tal is a Quantitative Analyst at I Know First. He is currently a candidate for his bachelor’s degree in Computer Science and Business Management at Columbia University.
While the I Know First algorithmic predictions for short-term stocks are often utilized for their relevance in timing mid and long-term investments, we back-test their ability to exploit market trends and offer high returns through multiple day trading models. In this article we explore in more detail one of the I Know First strategies in order to better understand the limitations and adjustments needed to implement it most efficiently when live-trading.
In order to do this, we back-test the Consistent Streak Strategy in Quantopian, an open sourced algorithmic trading development platform. With their minute level data and built-in slippage and commissions models we are able to simulate a more realistic trading environment and compute accurate statistics related to our strategy’s performance. We achieve this by adjusting our simulation to run from market open to market close (open-to-close) rather than from market close to market close (close-to-close), adding commissions costs, and implementing a slippage model to simulate volume limitations related to trading the selected equities. As expected these additions dent the strategy’s performance in the observed time-period, offering a more realistic picture of the achievable returns. However, by further leveraging the algorithm’s signals on an intraday time-scale we are able to improve the strategy’s performance to finally attain realistic portfolio returns above 45%. This demonstrates that our method can not only be implemented live but also improved by taking advantage of intraday trading rules and making calculated adjustments to maximize its performance.
The Strategy:
The I Know First proprietary algorithm provides a daily forecast which is comprised of a stock’s name, signal, and predictability. The signal is used to project the movement of a stock – a positive number meaning the stock’s price is predicted to rise, and a negative number forecasting a decrease in the stock’s value. In addition to the signal, a fitness function known as the predictability, shows the correlation based quality measure of each stock’s signal. With this information, a predictability threshold filter, and additional rules applied to the signal dynamics we are able to generate an average of eighteen top S&P500 stocks to be traded daily. The back-test covers the period since launching the model on January 7th, 2016 and through July 15th, 2016.
From Close-to-Close to Open-to-Close:
Our original simulation tests the strategy’s returns by daily trading from market close to market close. This theoretical way to show the performance of the algorithm’s stock choices produced strong returns (green line in the graph below), yet due to the algorithm’s forecasts being generated several hours after market close the simulation was not realistic. Thus to back-test a strategy implementable in real time we shifted to trading from market open to market close (blue line). As can be seen in the equity lines below, for this particular strategy no large changes were observed in the total return due to the shift in trading times.

A comparison of close-close simulations (green line) to open-close (light-blue) simulations. No significant changes are observed. (January 7th, 2016 through July 15th, 2016).
Adding Slippage and Commissions:
Although this back-test shows a great deal of promise, it is still not realistic enough to deal with the many implications of live-trading. Thus we utilize Quantopian’s slippage and commissions models to simulate a more realistic environment. The slippage model calculates the price impact our order sizes have on execution prices and only allows the algorithm to deal 2.5% of each security’s minute volume. Moreover, the commissions model is added to account for costs incurred by trading with Interactive Brokers. This is based on the most expensive trading commissions offered by the broker ($0.0035 per share, as of 8/9/16) in order to be as conservative as possible when obtaining the final returns. As expected, the more realistic environment weakened our strategy’s performance. This can be seen in the Quantopian statistics which show a decrease in the returns from 37.91% (see previous plot open-to-close) to 30.5% (below).

Quantopian’s statistical analysis of our portfolio’s performance after the addition of the slippage and commissions models. Notice the decrease in the total returns from the previous 37.91% to the above 30.5%. (January 7th, 2016 through July 15th, 2016).
Note: here the chosen benchmark is SPY – SPDR S&P 500 ETF, which makes the S&P 500 index investable.
Intraday Adjustments:
These back-tests help us understand the more realistic obstacles we face in live day trading and their implications on our strategy’s returns. However, this increased level of realism allows us to further leverage the algorithm’s forecasts through additional intraday rules applied to the selected stocks. Using Quantopian’s minute level data, we are able to exploit the short term stock movements and implement a strategy based on a mean-reverting logic, which complements and is consistent with our algorithmic daily stock picking decisions. Below are the results:

Quantopian’s statistical analysis of our portfolio’s performance after the addition of our intraday mean reversion strategy. (January 7th, 2016 through July 15th, 2016).
This unique strategy helps us stay within a realistic back-test while improving our total returns from 30.5% to 45.2%. The Quantopian analysis shows the Sharpe ratio increase to 5.07 with volatility at 0.17 providing considerably low-risk for such a high reward. Moreover, this strategy generates a high Alpha (0.81) and a very low Beta (0.22) which indicates that it is not strongly affected by the broad market.
Conclusion:
Finally, we juxtapose the three open to close simulations as well as the S&P500 index returns to illustrate their differences.
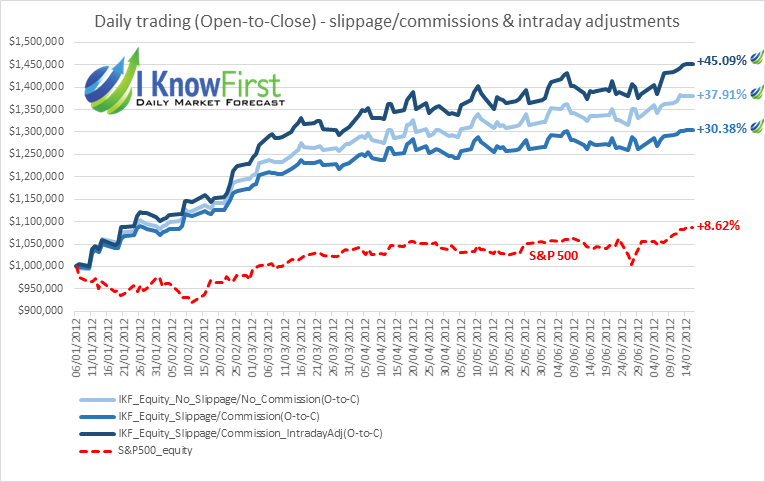
A comparison of the S&P500 index with our three open-close portfolio simulations. (January 7th, 2016 through July 15th, 2016).
After identifying specific implementation limitations in trading close to close, we were able to shift our simulation to trade from open-to-close without significantly impacting the algorithm’s performance. Although the slippage and commissions models reduced our total returns (light blue line to blue), the addition of an intraday mean reversion rule allowed us to further leverage the algorithm’s daily predictions. This considerably improved our strategy’s returns, even above the levels of the slippage- and commissions-free back-test. In conclusion, this analysis shows that the presented strategy is practically implementable in real world day trading and able to yield high returns.
People who read this article also liked:
- An Analysis of the I Know First Signal and Predictability Indicators
- Stock Predictions & Short-term Trading: 42% in 7 months
- I Know First Stock Forecast Algorithm