
Best Stock Predictions of the Week Based on AI: Returns up to 66.82%
Highlights
Five AI stock predictions that topped four I Know First forecasts heading into the last week of August 2026.
Windows: 3-day Tech Giants Aug 24–27, 2026 · 1-month Tech Giants and Implied Volatility Options Jul 27–Aug 27, 2026 · Russell 2000 Aug 14–28, 2026. Source: I Know First AI Predictive Algorithm. The NVDA figure is public market price data, not an IKF forecast result. Past performance does not guarantee future results.
The final week of August 2026 was an earnings week, and the results did the talking. Salesforce (CRM) and NVIDIA (NVDA) both reported after the close on August 26; Abercrombie & Fitch (ANF) reported the same day; ServiceNow (NOW) had reported a month earlier and never stopped climbing; and MicroStrategy, now Strategy (MSTR), rode a bitcoin rally to the biggest single-stock move on the board. Every one of them was already sitting inside an I Know First forecast published days or weeks earlier, before the catalyst was public. The S&P 500 gained roughly 4% over the month and less than a percent in the final three days; the I Know First AI-powered stock predictions returned multiples of that, because the names that moved were the names the algorithm had already ranked at the top.
This is a roundup of the week’s best AI-driven stock predictions, drawn from four published I Know First forecasts, the Tech Giants package at both a 3-day and a 1-month horizon, the Russell 2000 package, and the Implied Volatility Options package, with every heatmap included in full. Below: why CRM, ANF, NVDA, NOW and MSTR moved, what the market was actually reacting to, and how the algorithm’s stock predictions were positioned ahead of each catalyst.
The Week at a Glance
- WIX +66.82% in 1 month — the top forecast across all four books; the 1-month Tech Giants package finished 10 of 10 correct at +26.8% average vs. +4.3% for the S&P 500
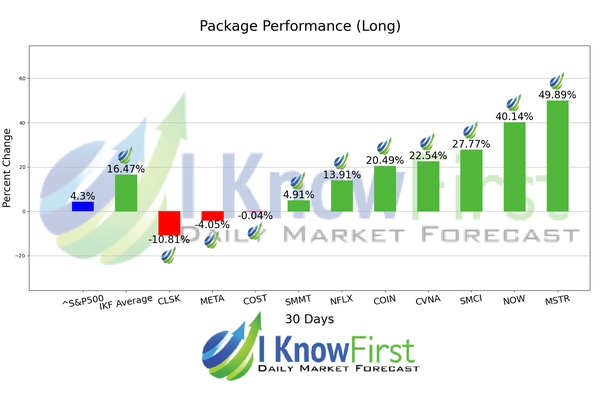
- MSTR +49.89% in 1 month — Strategy (formerly MicroStrategy) led the Implied Volatility Options forecast as bitcoin rallied through August; the algorithm’s top-ranked call in that book
- NOW +40.14% in 1 month — ServiceNow appeared in three of the four forecasts and carried a bullish signal in every one, plus another +7.74% in the final 3 days
- CRM +20.5% in 3 days — Salesforce topped the short-horizon Tech Giants forecast, then beat on Q2, raised FY27 guidance and expanded its Anthropic partnership two days later
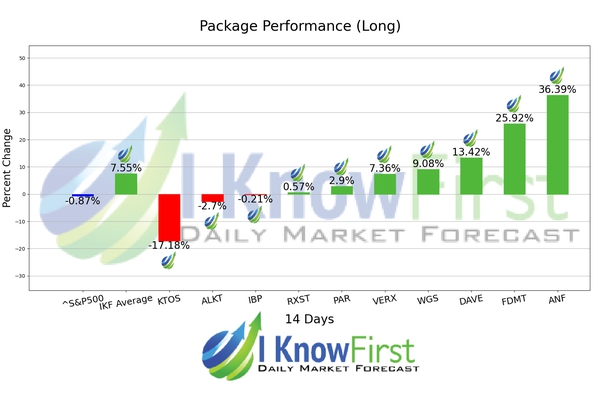
- ANF +36.39% in 14 days — Abercrombie & Fitch, ranked first in the Russell 2000 long book 12 days before its Q2 blowout
- NVDA approx. +8% post-earnings — $96B revenue, above-consensus guidance; held in the Tech Giants universe at both horizons (figure is public market data, not an IKF forecast result)
- Every move here was a scheduled-catalyst or macro move the algorithm was positioned for before it happened
Large Caps: Salesforce Led, and the Forecast Had It First
The full forecast is published on the original I Know First page: Best Tech Stocks Based on Stock Algorithm: Returns up to 20.5% in 3 Days.
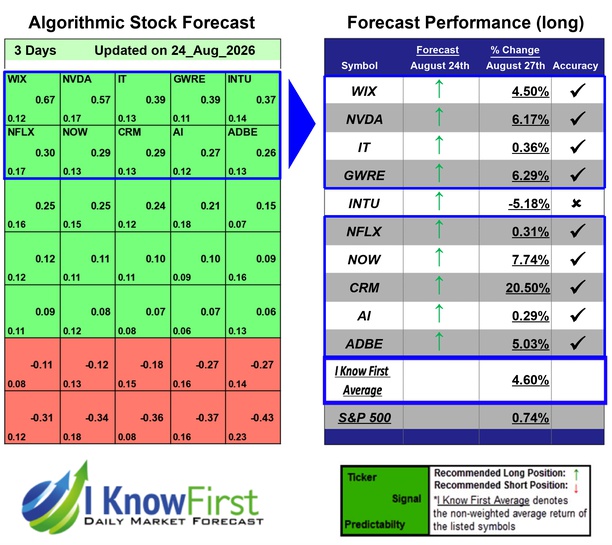
The Tech Giants universe is a who’s-who of the sector’s largest names. The long book for the August 24 forecast drew from a pool that includes NVIDIA (NVDA), Adobe (ADBE), Intuit (INTU), Netflix (NFLX), Wix (WIX), C3.ai (AI), Gartner (IT), Guidewire (GWRE), ServiceNow (NOW) and Salesforce (CRM). What matters is not that the algorithm held “big tech,” it is which names carried the highest combined signal and predictability scores going into the window. This week the top-ranked signal was Salesforce, with ServiceNow and Guidewire close behind and NVIDIA also carried into its August 26 report. Adobe, another universe name, did not score the same conviction into this particular window. Three days later, the ranking and the tape agreed: the package returned 4.6% on average while the S&P 500 added 0.74%, and 9 of 10 calls resolved in the predicted direction.
| Average Package Return | +4.6% |
| S&P 500 Return (same period) | +0.74% |
| Market Premium vs. S&P 500 | +3.86 pp |
| Prediction Accuracy | 9 / 10 |
| Top Single Forecast | CRM +20.5% |
| Ticker | Company | Sub-Sector | 3-Day Return |
|---|---|---|---|
| CRM | Salesforce, Inc. | Enterprise CRM / AI Agents | +20.5% |
| NOW | ServiceNow, Inc. | Enterprise Workflow Software | +7.74% |
| GWRE | Guidewire Software | Insurance Core Systems Software | +6.29% |
CRM Salesforce, Inc. +20.5% / 3 days
What happened: Salesforce reported its fiscal second quarter after the close on August 26 and the stock gapped up the next session, finishing the forecast window up 20.5%, one of its largest single-day moves on record. Revenue was $11.35 billion, up roughly 11% year over year, adjusted earnings came in well ahead of consensus, and management lifted full-year FY27 revenue guidance to a $46.1 billion to $46.4 billion range.
What the market was reacting to: the AI business, not the top line. Salesforce paired the print with an expanded partnership with Anthropic, a “Claudeforce” integration that puts Salesforce data and dozens of pre-built sales skills directly inside Claude, and pointed to accelerating traction in its Agentforce and Data Cloud lines. For a stock that spent much of 2026 under a “can software monetize AI, or does it just pay for it” cloud, this was the quarter that answered the question, and the multiple re-rated on it.
How the algorithm saw it first: the Tech Giants forecast was generated on August 24, two trading days before the release. CRM was the algorithm’s single strongest bullish signal in the package on that date, high directional conviction paired with the elevated predictability that a large, heavily-covered name with a consistent post-report reaction pattern carries. The model does not forecast earnings; it reads the accumulation and price-behavior patterns that tend to precede a move, and here those patterns were already flashing before the catalyst was public.
NOW ServiceNow, Inc. +7.74% / 3 days
ServiceNow is the same trade one step removed: a workflow-automation platform embedded deep in enterprise IT operations, with a subscription base that renews on its own multi-year cadence and an AI upsell layered on top. When the software complex leads, NOW tends to travel with CRM, and it did here, adding 7.74% over the three days and confirming the algorithm’s second bullish call in the package. The read-through is that this was a group move in application software, not a single-stock story.
GWRE Guidewire Software +6.29% / 3 days
Guidewire sells policy, billing and claims platforms to property and casualty insurers, one of the stickiest revenue bases in software. Its multi-year cloud-migration cycle runs on a schedule that is largely independent of the broader tech tape, which is exactly why the algorithm’s models tend to find it predictable. The 6.29% gain rounded out the package’s three named leaders and reinforced the week’s pattern: recurring-revenue vertical and enterprise software, not hardware.
NVDA NVIDIA Corporation approx. +8% post-earnings (market data)
What happened: NVIDIA reported after the close on August 26 and shares rose roughly 8% in the following session, inside the same August 24 to 27 window. Quarterly revenue was about $96 billion, up more than 100% year over year, and the forward guidance was the real surprise: management framed a fiscal 2028 growth path well above what analysts had modeled.
What the market was reacting to: the capex debate. Investors went into the quarter asking whether hyperscaler AI-infrastructure spending had peaked. The guidance said no. NVIDIA, and the broader semiconductor and large-cap tech tape, moved up on the read-through that data-center demand still has room to run.
How the algorithm saw it first: NVIDIA is a core constituent of the Tech Giants forecast universe, and the August 24 forecast, published two days before the report, scored it on the same signal-and-predictability axes as every other name in the book, heading into a binary catalyst. The roughly 8% move quoted here is public market data over the post-earnings session, included for context; I Know First’s published leaders for the week were CRM, NOW and GWRE. The point is that the algorithm did not have to pick between the software trade and the semiconductor trade this week, it was positioned across both, and the package’s +4.6% average with 9 of 10 calls correct reflects that.

The Same Package, One Month Out
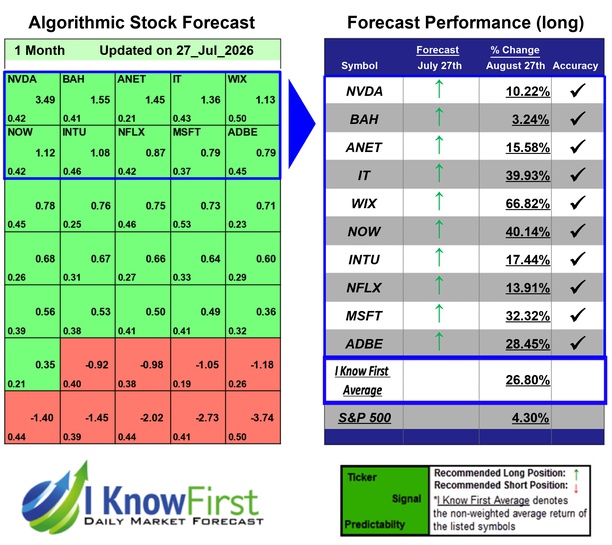
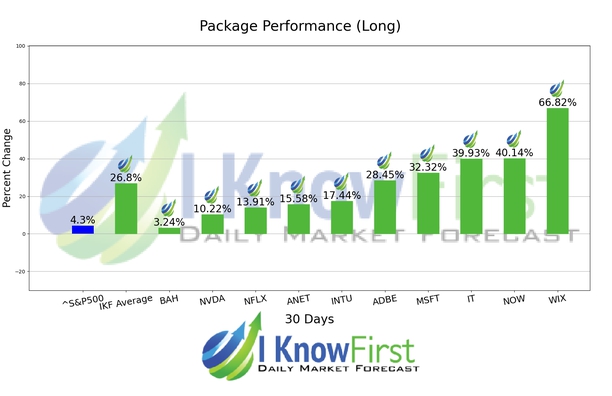
The 3-day forecast above is the short-horizon view of the Tech Giants package. I Know First also publishes it on a 1-month horizon, and that book, covering July 27 to August 27, is where the enterprise-software move showed its full size. It returned +26.8% on average against +4.3% for the S&P 500, and every one of its ten calls resolved in the predicted direction, a 10-for-10 month.
| Average Package Return | +26.8% |
| S&P 500 Return (same period) | +4.3% |
| Market Premium vs. S&P 500 | +22.5 pp |
| Prediction Accuracy | 10 / 10 |
| Top Single Forecast | WIX +66.82% |
| Ticker | Company | Sub-Sector | 1-Month Return |
|---|---|---|---|
| WIX | Wix.com Ltd. | Website / SMB Software Platform | +66.82% |
| NOW | ServiceNow, Inc. | Enterprise Workflow Software | +40.14% |
| IT | Gartner, Inc. | IT Research & Advisory | +39.93% |
NVIDIA and Adobe were both in this 10-for-10 month, and it is the cleaner way to see the point made earlier. The algorithm did not have to nail the exact 3-day path around NVIDIA’s earnings to be right about the direction over the month. Over the full window, Q2 print included, both names resolved the way the package called them.
Small Caps: Catalyst-Driven Russell 2000 Stock Predictions
The full forecast is published on the original I Know First page: Russell 2000 Stocks Based on Artificial Neural Networks: Returns up to 36.39% in 14 Days.
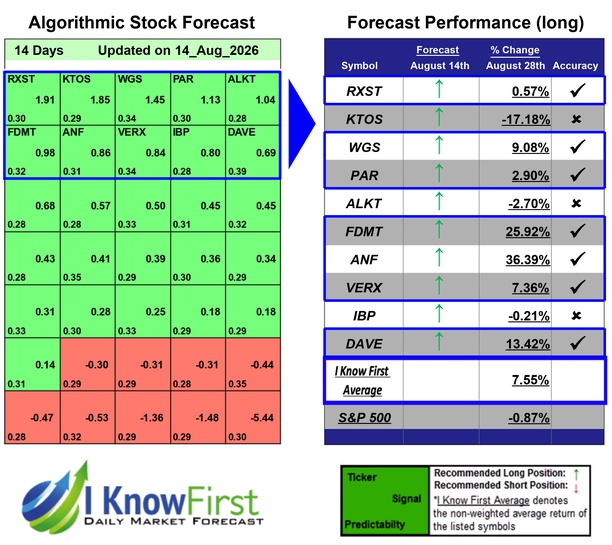
The Russell 2000 forecast is a Top 10 Stocks Package: ten long and ten short positions in small-cap U.S. equities, refreshed daily and driven by the same neural-network and genetic-algorithm engine. Over the 14 days from August 14 to August 28, the long book returned +7.55% on average while the S&P 500 slipped -0.87%, a market premium of +8.42 percentage points, with 7 of 10 trades finishing profitable. Small caps as an asset class went nowhere over the fortnight; the algorithm’s edge came from picking the individual names with earnings and pipeline catalysts.
| Average Package Return | +7.55% |
| S&P 500 Return (same period) | -0.87% |
| Market Premium vs. S&P 500 | +8.42 pp |
| Prediction Accuracy | 7 / 10 |
| Top Single Forecast | ANF +36.39% |
| Ticker | Company | Sub-Sector | 14-Day Return |
|---|---|---|---|
| ANF | Abercrombie & Fitch Co. | Apparel Retail / Consumer Discretionary | +36.39% |
| FDMT | 4D Molecular Therapeutics | Clinical-Stage Biotech | +25.92% |
| DAVE | Dave Inc. | Consumer Fintech / Neobank | +13.42% |
ANF Abercrombie & Fitch Co. +36.39% / 14 days
What happened: Abercrombie & Fitch reported its fiscal second quarter on August 26 and the stock rose roughly 36% on the day, its largest move in years, finishing the algorithm’s 14-day forecast window up 36.39%. It was the single highest-returning position across both forecasts covered here.
What the market was reacting to: a wide beat on top of an already-long growth streak. Adjusted earnings came in around $4.17 per share against roughly $2.00 expected, revenue rose about 5% year over year to $1.3 billion, and it was the company’s fifteenth consecutive quarter of sales growth, with every region positive. Two things turned a good quarter into a violent re-rating: operating margin near 20% against guidance closer to 10%, and roughly $100 million in tariff refunds that added materially to per-share earnings. Management then raised full-year guidance across sales, EPS and buybacks. The market had been pricing ANF as a fading turnaround; the quarter said it was still compounding.
How the algorithm saw it first: the Russell 2000 forecast that carried ANF was generated on August 14, twelve days before the earnings release, and ANF was ranked at the top of the ten-name long book on that date. The neural-network and genetic-algorithm models were not forecasting a tariff refund or a margin beat; they were reading the price and accumulation behavior in the stock ahead of the print, and that pattern put ANF first in the book before the catalyst arrived. For a small-cap forecast to lead with a consumer name rather than a biotech or a defense play was itself a tell about where the algorithm saw asymmetric upside heading into late August.
FDMT 4D Molecular Therapeutics +25.92% / 14 days
Clinical-stage biotech is the highest-variance sleeve in any small-cap book, and it is where binary catalysts, trial data, regulatory milestones, partnership news, produce the outsized two-week moves. FDMT’s 25.92% gain is characteristic of that profile. The algorithm does not forecast trial outcomes; it reads the accumulation and price-behavior patterns that tend to precede them, and in this case the signal resolved in the predicted direction, adding the package’s second-largest contribution.
DAVE Dave Inc. +13.42% / 14 days
Dave is a consumer-fintech neobank, a high-beta name that trades on user-growth and unit-economics inflections. Its 13.42% advance over the fortnight fits the week’s broader tell: capital rewarding small caps with a visible earnings trajectory while the index-level Russell tape stayed flat. Three names up double digits or better, out of a ten-position long book, did the heavy lifting behind the +7.55% average.
The Options Book: Calling Direction on the Market’s Wildest Names

The full forecast is published on the original I Know First page: Implied Volatility Options Based on AI-Algorithm: Returns up to 49.89% in 1 Month.
The Implied Volatility Options package is built for a different job than the two forecasts above. It ranks the highest-implied-volatility names in the market, the stocks the options market has already priced for large moves, and picks the ten calls and ten puts where the algorithm has the most directional conviction. Over the month from July 27 to August 27, the same window that closed with the Tech Giants forecast, the book returned +16.47% on average against +4.3% for the S&P 500, with 7 of 10 trades correct. Two names carried it: MicroStrategy, now Strategy (MSTR), at +49.89%, and ServiceNow (NOW) at +40.14%.
| Average Package Return | +16.47% |
| S&P 500 Return (same period) | +4.3% |
| Market Premium vs. S&P 500 | +12.17 pp |
| Prediction Accuracy | 7 / 10 |
| Top Single Forecast | MSTR +49.89% |
| Ticker | Company | Sub-Sector | 1-Month Return |
|---|---|---|---|
| MSTR | Strategy (formerly MicroStrategy) | Bitcoin Treasury / Software | +49.89% |
| NOW | ServiceNow, Inc. | Enterprise Workflow Software | +40.14% |
| SMCI | Super Micro Computer | AI Server Hardware | +27.77% |
MSTR Strategy (formerly MicroStrategy) +49.89% / 1 month
What happened: Strategy was the single best-returning position across all three forecasts in this roundup, up 49.89% over the month. The stock bounced from a close near $93 in mid-August toward the mid-$120s by the 24th, one of the strongest moves in large-cap crypto-linked equities over the stretch.
What the market was reacting to: bitcoin. Strategy is the largest corporate holder of bitcoin, with a stack north of 840,000 coins, which makes the equity a leveraged proxy for the cryptocurrency. Bitcoin rallied through the back half of August, swinging the unrealized mark on that position by more than a billion dollars, and sell-side targets moved with it, including a lift from Canaccord to $175. When bitcoin runs, MSTR runs harder, and it did.
How the algorithm saw it first: MSTR is a permanent resident of the highest-implied-volatility list; the options market never stops pricing it for a large move. What the algorithm adds there is direction. Its July 27 forecast put a bullish signal on MSTR going into the month, and the crypto rally that followed resolved it as the book’s top call.
NOW ServiceNow, Inc. +40.14% / 1 month
What happened: ServiceNow is the one name that shows up in three of the four forecasts here. It returned 40.14% over the month in both the Implied Volatility Options book and the 1-month Tech Giants book, and added another 7.74% in the final three days of the short-horizon Tech Giants forecast. The month-long move started with the company’s Q2 report on July 22.
What the market was reacting to: a beat-and-raise with the margins intact. ServiceNow posted adjusted earnings of $0.90 on $3.99 billion of revenue, both ahead of consensus, with roughly 24% revenue growth and a non-GAAP operating margin near 29.5% that beat guidance by about 300 basis points. Management raised full-year subscription-revenue guidance and flagged that AI-related contract value had already crossed $1 billion, ahead of plan. After an initial dip on the print, the stock rallied and kept climbing.
How the algorithm saw it first: NOW carried a bullish signal in the Implied Volatility Options forecast dated July 27, days after the report, and again in the Tech Giants forecast dated August 24. Two independent I Know First packages, built on different universes, both ranked ServiceNow as a buy into the same stretch. The stock delivered on both.
COIN Coinbase Global, Inc.
What happened: Coinbase was the other crypto-beta name in the Implied Volatility Options book, alongside MSTR and miners such as CleanSpark (CLSK). It ran with the group in the back half of August, gaining on the order of 30% across a two-day stretch on the heaviest volume in months, turning one of 2026’s most beaten-down large-cap tech names into a momentum trade. I Know First does not publish an individual return figure for COIN on this forecast page.
What the market was reacting to: a stack of catalysts hitting at once, bitcoin breaking to multi-month highs, the SEC advancing a token-market rule proposal, and a White House crypto meeting that Coinbase attended. The fundamentals were not the story: Q2 revenue actually fell year over year and the company posted a net loss, even as it captured a record share of global crypto trading volume. This was a regulatory-and-macro re-rating, and Coinbase is the most liquid way to express it.
How the algorithm saw it first: COIN sits permanently near the top of the implied-volatility rankings; the options market is always braced for a large move in it. The July 27 forecast carried a bullish directional signal into the month, the same read that put MSTR at the top of the book, and the crypto rally that followed resolved the group together.
The Common Thread: Positioned Before the Catalyst
The biggest single-stock moves in this roundup, CRM, NVDA, ANF, NOW and MSTR, split into two groups. The first is scheduled earnings: a wide beat or a guidance surprise, then a gap higher, for Salesforce, NVIDIA, Abercrombie and ServiceNow. The second is macro: bitcoin’s August rally lifting Strategy and the rest of the crypto-beta complex. What separated the I Know First packages from a reactive trade was timing. The 1-month forecasts were published on July 27; the Russell 2000 book on August 14; the short-horizon Tech Giants forecast on August 24. Every catalyst came after the forecast, and in every case the algorithm had already ranked the name near the top of its book. The 1-month Tech Giants package went 10 for 10.
The stock predictions do not forecast earnings results. The algorithm scans more than 13,500 assets every day across six time horizons and scores each on two axes, signal strength and predictability, surfacing the names whose price and accumulation behavior resemble the setups that have historically preceded a move. This week those setups showed up in enterprise software with an AI-monetization catalyst and in a small-cap retailer the market had written off. Neither the S&P 500 nor the Russell 2000 gave investors much to work with over these windows, the large-cap index rose less than a percent in three days and the small-cap tape was slightly negative over two weeks. Being in the specific names is what produced the return.
Access AI-Powered Stock Predictions
Receive daily stock predictions across 13,500+ assets, including dedicated packages for large-cap technology and Russell 2000 small caps, updated every morning across six time horizons.
View Subscription PackagesImportant Disclosure: Past performance does not guarantee future results. All I Know First performance figures are sourced from the I Know First AI Predictive Algorithm. Tech Giants Stocks Forecast (3-day): From August 24, 2026 up until August 27, 2026. Tech Giants Stocks Forecast (1-month) and Implied Volatility Options Forecast: From July 27, 2026 up until August 27, 2026. Russell 2000 Stocks Forecast: From August 14, 2026 up until August 28, 2026. S&P 500 figures represent index price performance over the corresponding periods. The NVIDIA (NVDA) return cited is public market price performance over the post-earnings session and is not an I Know First forecast result. No individual return is published for Coinbase (COIN) on the Implied Volatility Options forecast page. Earnings figures for CRM, NVDA, ANF and NOW, and bitcoin and price commentary for MSTR, are drawn from company reports and public reporting. This article is for informational purposes only and does not constitute investment advice. Individual results will vary.


