
Top Performing Stocks Based on Big Data Analytics : Returns up to 18.94% in 14 Days
Top Performing Stocks
This top S&P 500 stocks forecast is designed for investors and analysts who need predictions for the whole S&P 500 (See S&P 500 Companies Package). It includes 40 stocks with bullish and bearish signals and indicates the top performing S&P 500 Companies stocks:
- Top 20 S&P 500 stocks for the long position
- Top 20 S&P 500 stocks for the short position

Package Name: S&P500 Companies
Recommended Positions: Long
Forecast Length: 14 Days (8/28/2019 – 9/11/2019)
I Know First Average: 6.24%
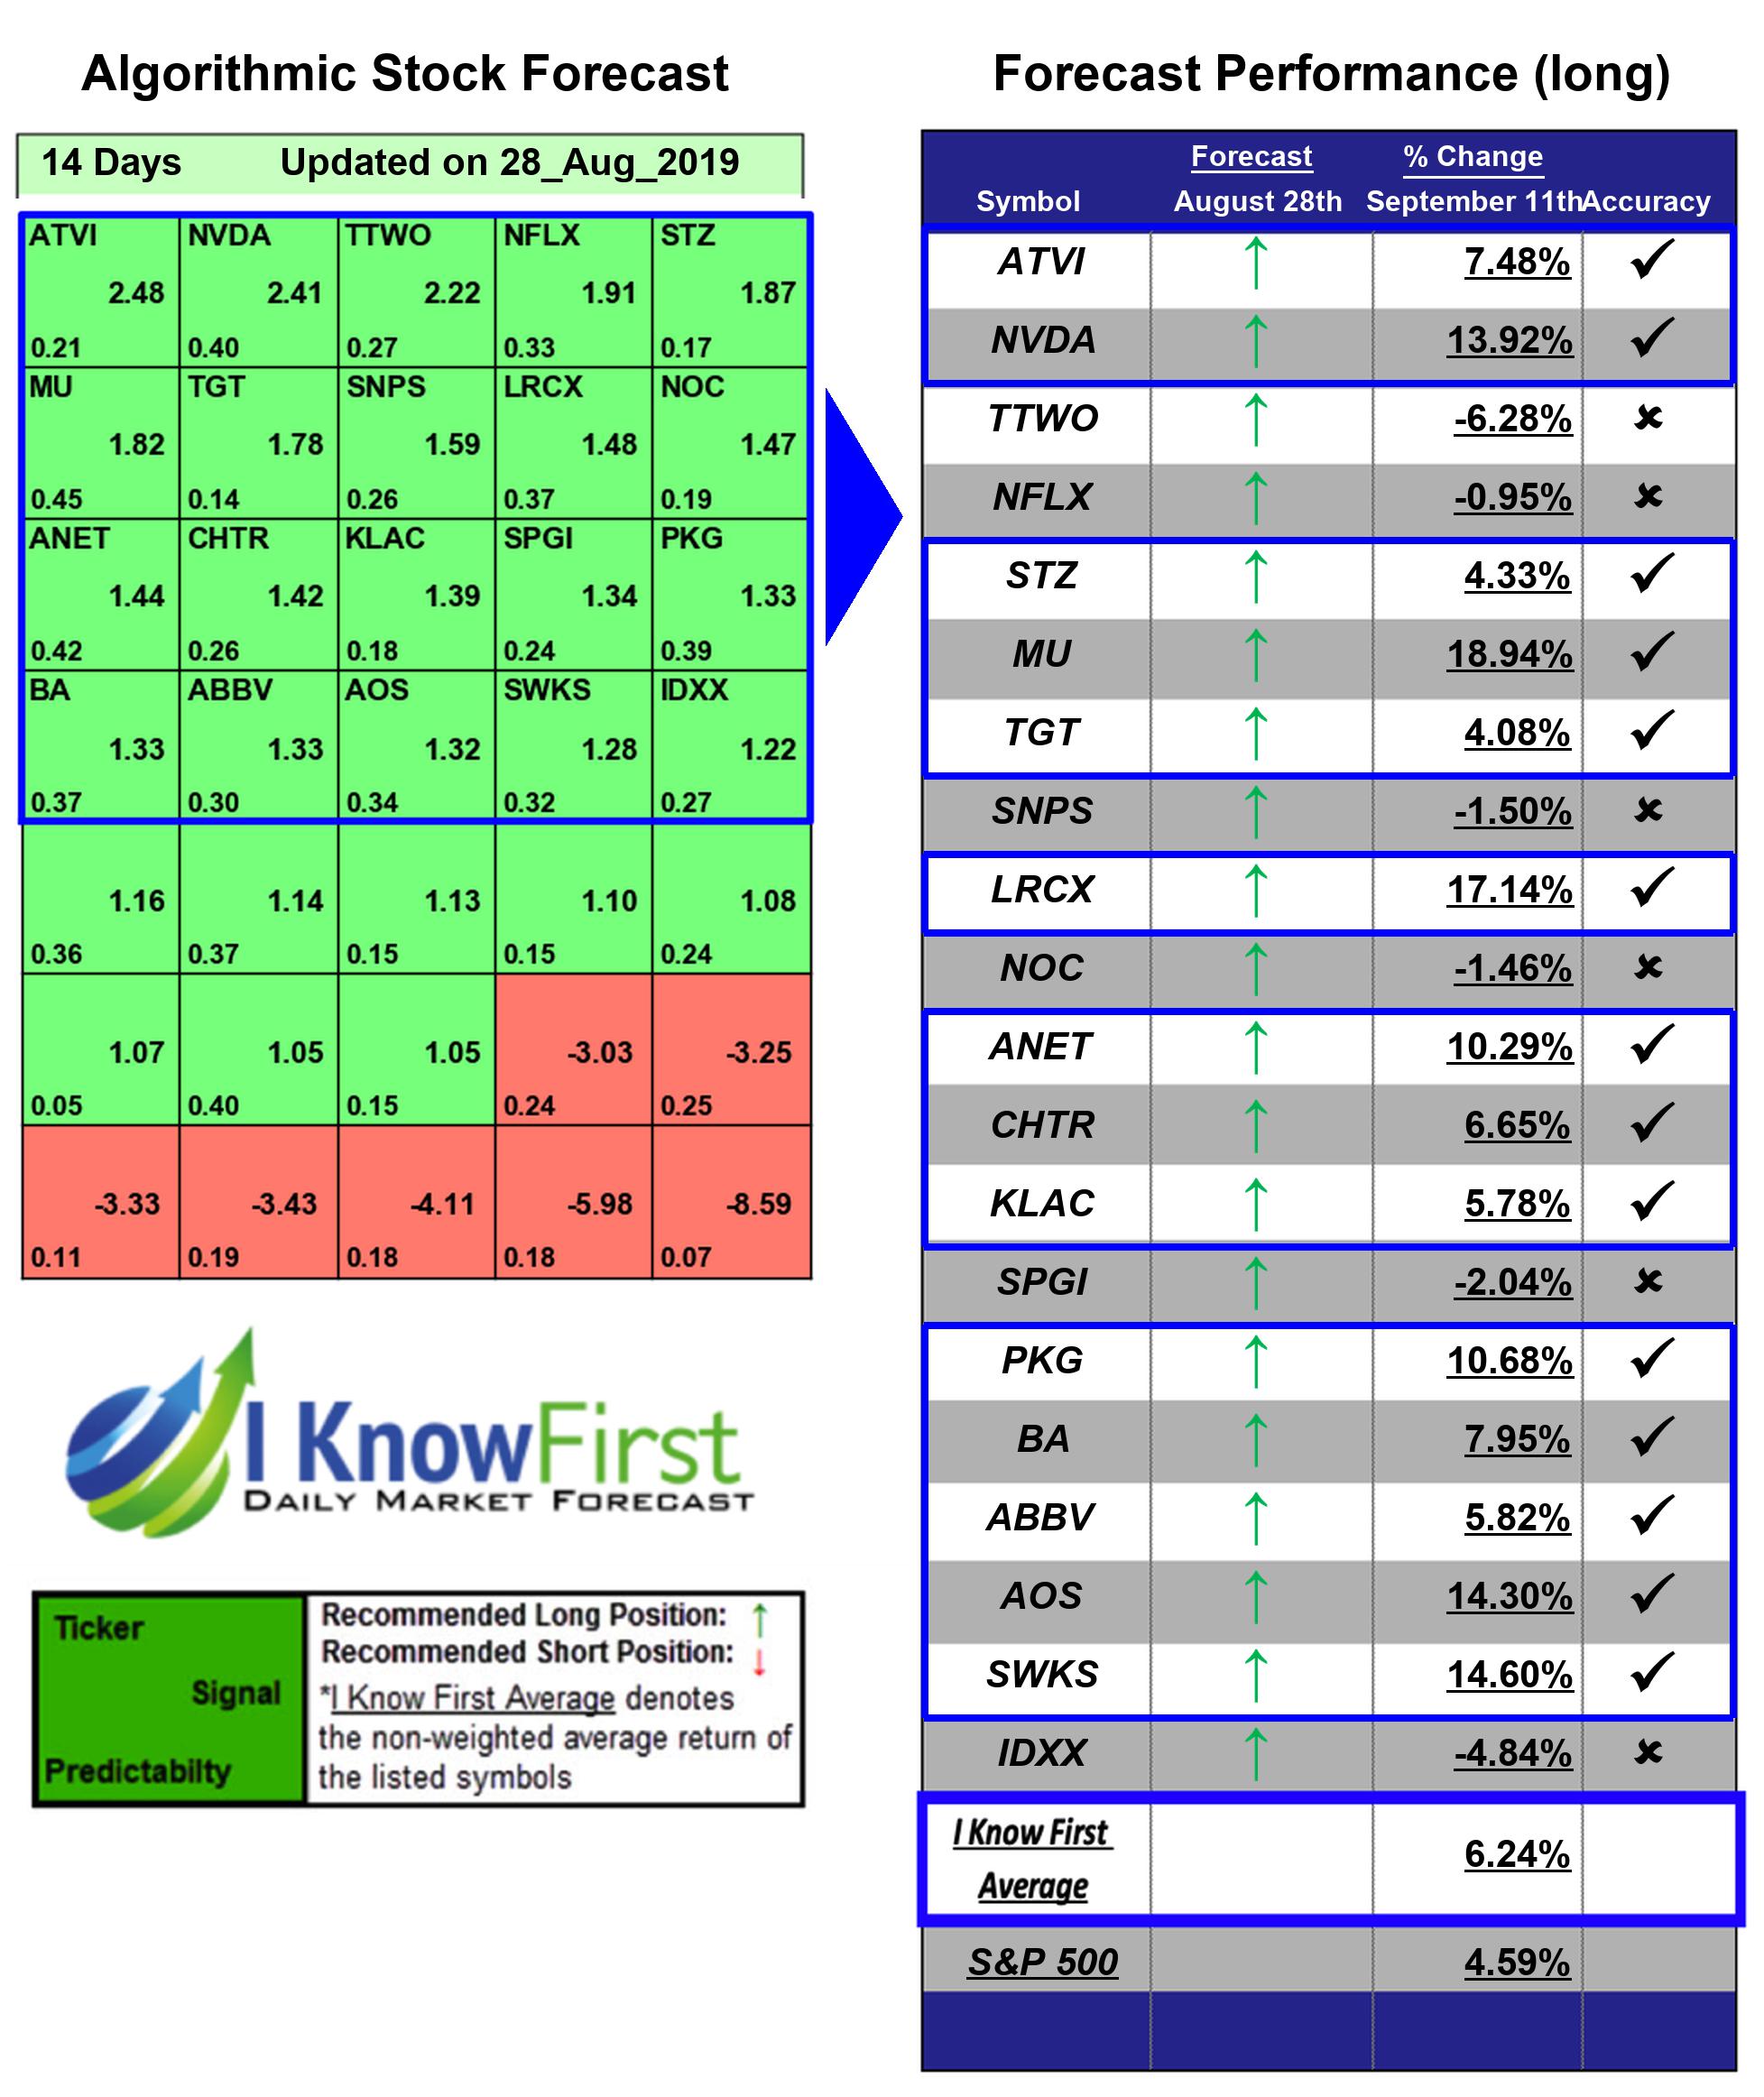
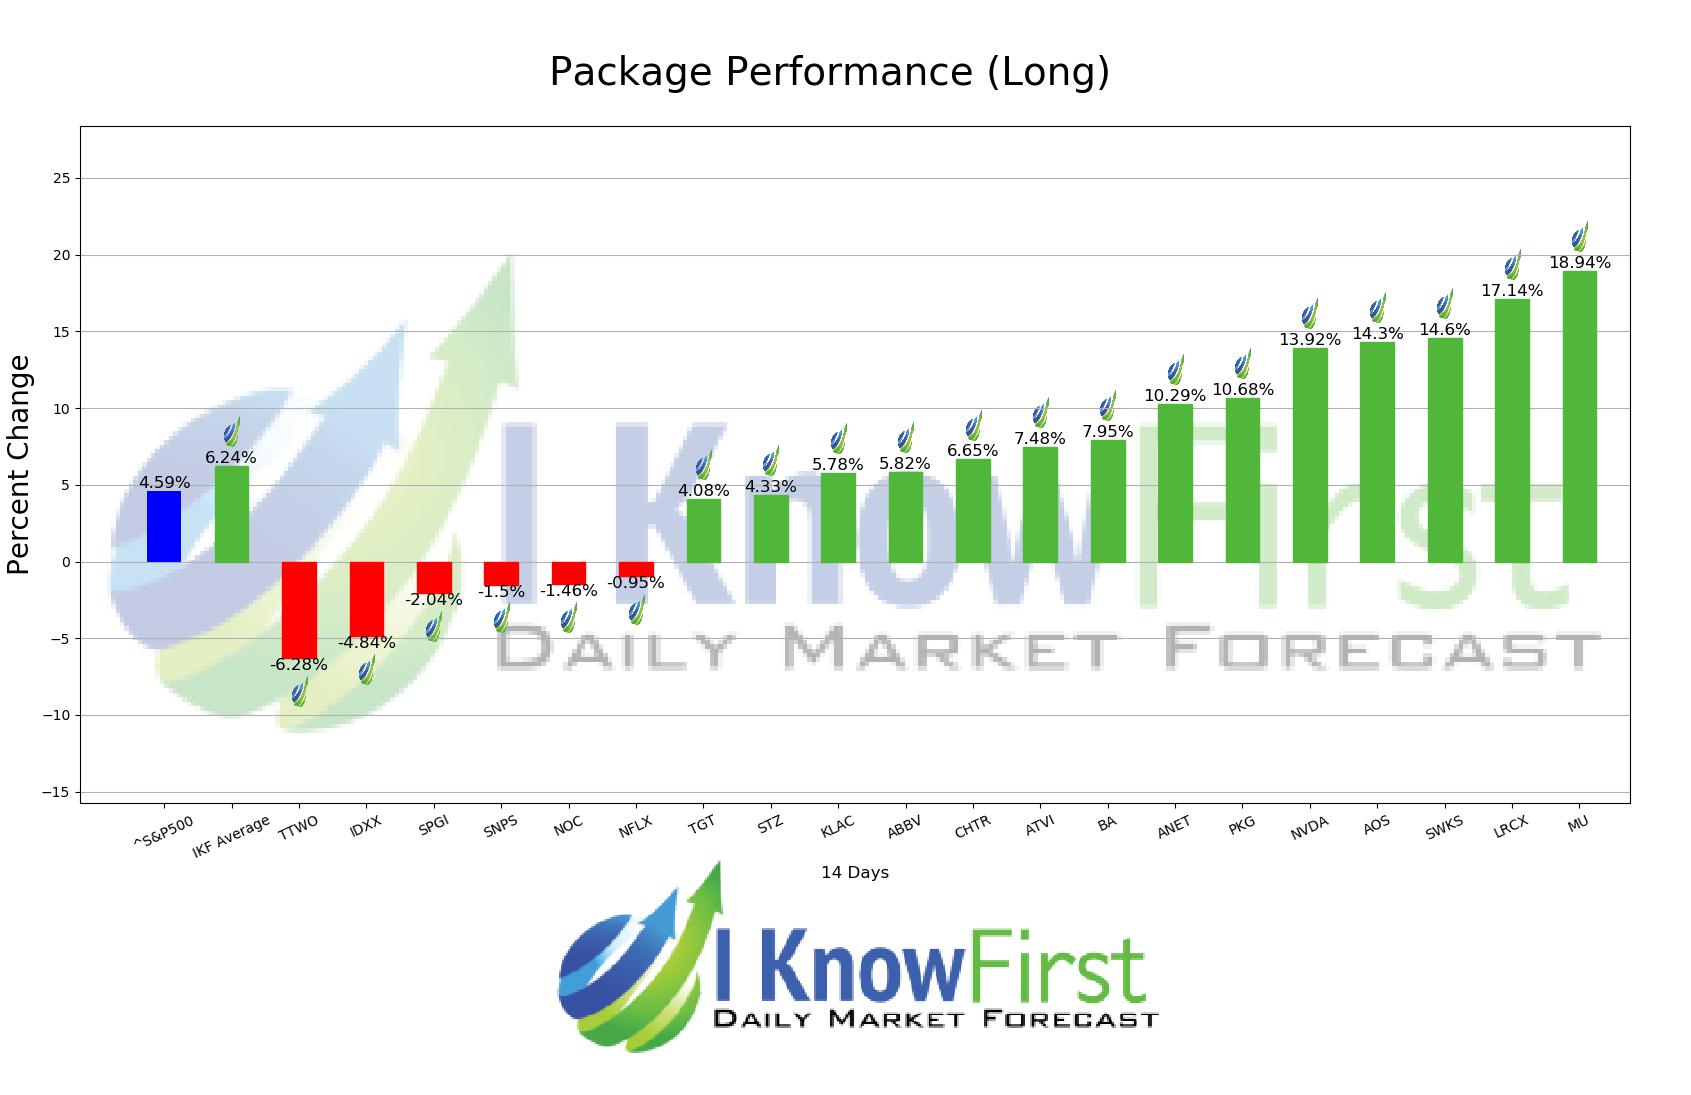
Several predictions in this 14 Days forecast saw significant returns. The algorithm had correctly predicted 14 out 20 stock movements. The top-performing prediction in this forecast was MU, which registered a return of 18.94%. Further notable returns came from LRCX and SWKS at 17.14% and 14.6%, respectively. The package itself saw an overall return of 6.24%, providing investors with a 1.65% premium above the S&P 500’s return of 4.59% for the same time period.
Micron Technology, Inc. (MU) through its subsidiaries, manufactures and markets dynamic random access memory chips (DRAMs), very fast static random access memory chips (SRAMs), Flash Memory, other semiconductor components, and memory modules. It is a part of the Semiconductor Devices industry.
Algorithmic traders utilize these daily forecasts by the I Know First market prediction system as a tool to enhance portfolio performance, verify their own analysis and act on market opportunities faster. This forecast was sent to current I Know First subscribers.
How to interpret this diagram
Algorithmic Stock Forecast: The table on the left is a stock forecast produced by I Know First’s algorithm. Each day, subscribers receive forecasts for six different time horizons. Note that the top 20 stocks in the 1-month forecast may be different than those in the 1-year forecast. In the included table, only the relevant stocks have been included. The boxes are arranged according to their respective signal and predictability values (see below for detailed definitions). A green box represents a positive forecast, suggesting a long position, while a red represents a negative forecast, suggesting a short position.
Please note-for trading decisions use the most recent forecast. Get today’s forecast and Top stock picks.


