
Stock Market Predictions – How to Interpret the I Know First Diagram?
Algorithmic Stock Market Predictions
The I Know First Algorithm creates forecasts for financial assets on six different time horizons. We create heatmaps for each forecast package and time horizon. Every box in the heatmap consists of a stock ticker, its signal, and its predictability indicator, as seen in the graphic below.

Every day we post how our different forecasting packages have performed over the different time horizons: 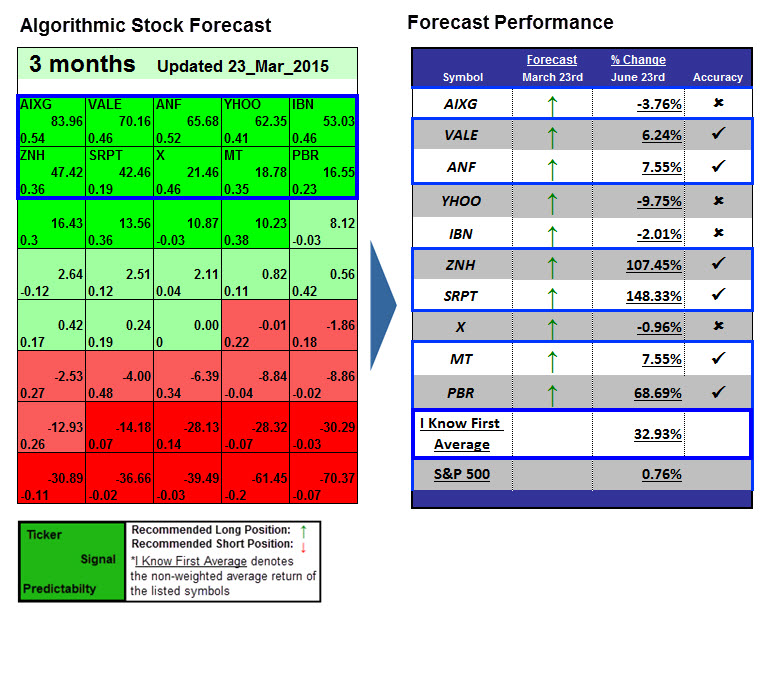
How to interpret this diagram:
Algorithmic Stock Forecast
The table on the left is a stock forecast produced by I Know First’s algorithm. Each day, subscribers receive forecasts for six different time horizons. Note that the top ten stocks in the 1-month forecast may be different than those in the 1-year forecast. In the included table, only the relevant tickers have been included. The boxes are arranged according to their respective signal and predictability values (see below for detailed definitions). A green box represents a positive forecast, suggesting a long position, while a red represents a negative forecast, suggesting a short position.
Signal
This indicator represents the predicted movement/trend of the asset; not a percentage or specific target price. The signal strength indicates how much the current price deviates from what the system considers an equilibrium or “fair” price.
The sign of the signal tells in which direction the asset price is expected to go (positive = to go up = Long, negative = to drop = Short position), the signal strength is related to the magnitude of the expected return and is used for ranking purposes of the investment opportunities.
Predictability (P)
This value is obtained by calculating the average correlation coefficient between the past predictions and the actual asset movement for three discrete time periods. The averaging gives more weight to more recent performances. As the machine keeps learning, the values of P generally increase.
Predictability is the actual fitness function being optimized every day, and can be simplified explained as the correlation based quality measure of the signal. This is a unique indicator of the I Know First algorithm. This allows users to separate and focus on the most predictable assets according to the algorithm. Ranging between -1 and 1, one should focus on predictability levels significantly above 0 in order to fill confident about/trust the signal.
Forecast Performance
The table on the right compares the actual stock performance with I Know First’s prediction. The “Forecast” column shows which direction the algorithm predicted, and the “% Change” column shows the actual stock performance over the indicated time period. The “Accuracy” column shows a “√” if the algorithm correctly predicted the direction of the stock or an “x” if the forecast was incorrect. The I Know First Average is the equal-weights average percent change of the stocks listed above. The S&P 500 may be included for reference if relevant.
The Algorithm
The system is a predictive algorithm based on Artificial Intelligence (AI) and Machine Learning (ML) with elements of Artificial Neural Networks and Genetic Algorithms incorporated in it. The system’s predictive analytics are self-updating, and thus live. The algorithm is a powerful resource for any investor conducting black-box trading or algotrading. Please note – for trading decisions, use the most recent forecast.


