
Top ETFs: Daily Forecast Performance Evaluation Report
Executive Summary
In this stock market forecast evaluation report, we will examine the performance of the forecasts generated by the I Know First AI Algorithm for the top ETFs for long and short positions (20 ETFs) which were sent daily to our customers. Our analysis covers the time period from January 1, 2019, to May 24, 2020 and further analyzes the performance of the US market since the coronavirus pandemic, February 20th, 2020 (see S&P500 Price Movement chart below).


Top ETFs Evaluation Highlights:
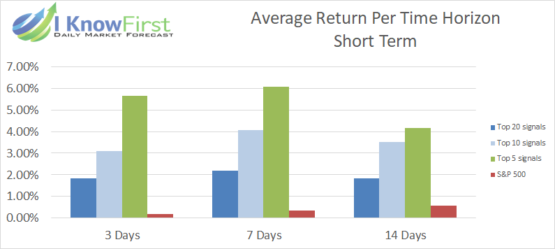
- The most impressive outperformance of the S&P 500 Index is from the Top 5 signal group in the 3-day horizon with 28 times more returns.
- The Top 20, Top 10, and Top 5 signal groups generated by I Know First succeeded in outperforming S&P 500 Index in short term horizons.
- The Top 5 signal group generated by I Know First succeeded in outperforming S&P 500 Index in the one-year horizon.
- Every signal group generated by I Know First succeeded in outperforming S&P 500 since Coronavirus pandemic.
- Every signal group has hit ratios equal to or higher than 50% for all time horizons.
The above results were obtained based on forecasts’ evaluation over the specific time period using a consecutive filtering approach – by predictability, then by signal, to give an overview of the forecasting capabilities of the algorithm for the specific stock universe.
About the I Know First Algorithm

The I Know First self-learning algorithm analyzes, models, and predicts the stock market. The algorithm is based on Artificial Intelligence (AI) and Machine Learning (ML) and incorporates elements of Artificial Neural Networks and Genetic Algorithms.
The system outputs the predicted trend as a number, positive or negative, along with a wave chart that predicts how the waves will overlap the trend. This helps the trader to decide which direction to trade, at what point to enter the trade, and when to exit. Since the model is 100% empirical, the results are based only on factual data, thereby avoiding any biases or emotions that may accompany human derived assumptions.
The human factor is only involved in building the mathematical framework and providing the initial set of inputs and outputs to the system. The algorithm produces a forecast with a signal and a predictability indicator. The signal is the number in the middle of the box. The predictability is the number at the bottom of the box. At the top, a specific asset is identified. This format is consistent across all predictions.
Our algorithm provides two independent indicators for each asset – Signal and Predictability.
The Signal is the predicted strength and direction of the movement of the asset. Measured from -inf to +inf.
The predictability indicates our confidence in that result. It is a Pearson correlation coefficient between past algorithmic performance and actual market movement. Measured from -1 to 1.
You can find a detailed description of our heatmap here.
Evaluating ETF Forecasts: Top 10 ETFs Package
ETF Forecast
Top 10 ETFs Package is one of I Know First’s systematic trading tools. The package includes a daily prediction for a total of 20 ETFs with bullish and bearish signals:
- Top 10 ETFs for the long position
- Top 10 ETFs for the short position
For the analysis we group the forecasts by absolute signals since these strategies are long and short. If the signal is positive, then we buy and if negative, we short.
The Stock Market Forecast Performance Evaluation Method
We perform evaluations on the individual forecast level. It means that we calculate what would be the return of each forecast we have issued for each horizon in the testing period. Then, we take the average of those results by strategy and forecast horizon.
For example, to evaluate the performance of our 1-month forecasts, we calculate the return of each trade by using this formula:

This simulates a client purchasing the asset based on our prediction and selling it exactly 1 month in the future.
We iterate this calculation for all trading days in the analyzed period and average the results.
Note that this evaluation does not take a set portfolio and follow it. This is a different evaluation method at the individual forecast level.
The Hit Ratio Method
The hit ratio helps us to identify the accuracy of our algorithm’s predictions.
Using our Daily Forecast asset filtering, we predict the direction of the movement of different assets. Our predictions are then compared against actual movements of these assets within the same time horizon.
The hit ratio is then calculated as follows:

For instance, a 90% hit ratio for a predictability filter with a top 10 signal filter would imply that the algorithm correctly predicted the price movements of 9 out of 10 assets within this particular set of assets.
The Benchmarking Method – S&P 500 Index
In order to evaluate our algorithm’s performance in comparison to the US market, we used the S&P 500 index as a benchmark.
The S&P 500 measures the stock performance of the largest 500 companies by market cap listed on different stock exchanges in the United States. It is one of the most followed equity indices and is frequently used as the best indicator for the overall performance of US public companies, and the US market as a whole. S&P 500 is a capitalization-weighted index, the weight of each company in the index is determined based on its market cap divided by the aggregate market cap of all the S&P 500 companies.
For each time horizon, we compare the S&P 500 performance with the performance of our forecasts.
Performance Evaluation – Overview
In this report, we conduct testing for the ETFs that I Know First covers by its algorithmic forecast. The period for evaluation and testing is from January 1st, 2019 to May 24th, 2020. During this period, we were providing our clients with daily forecasts for ETFs in time horizons spanning from 3 days to 1 year which we evaluate in this report.

As can be seen by Table 1, our algorithm provided almost all positive returns. The S&P 500 benchmark was outperformed by every signal group for short term horizons (3 days, 7 days, 14 days), up to 28 times more return than the benchmark for the 3 days time period. The Top 5 signal group also outperformed the benchmark index by 2.84% in the 365-day time horizon. Although the algorithm gave some negative returns in the 30-day and 90-day time horizons, it remained consistent throughout each signal group, providing mostly positive returns over the S&P 500. It is also evident that with each following signal group, the returns increase. The Top 5 signal group has higher returns than the Top 10 signal group which has higher returns than the Top 20 signal group. This shows the algorithm’s increased accuracy with each subsequent forecast narrowing down the best ETFs to trade.


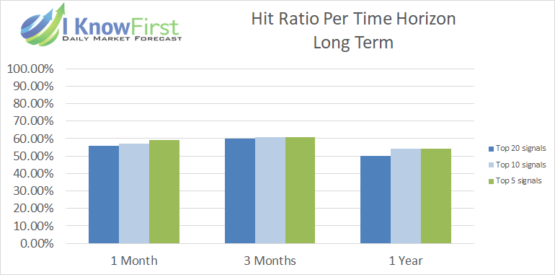
According to Table 2, each signal group across every time horizon gave a hit ratio greater than 50%. This shows that the algorithm’s accuracy is consistent and reliable. As observed from Table 1 and 2, the hit ratios for the highest performing return periods were well above 50%. Per example, the Top 5 signal group for short-term horizons and the 1-year horizon all had hit ratios between 54-61% and returns that outperformed the S&P 500 Index by a large margin, suggesting the consistent accuracy of the algorithm. The Top 5 signal group for the 14-day and 90-day time horizon along with the Top 10 signal group for the 90-day time horizon all gave the highest hit ratio of 61% accuracy.
Performance Evaluation – Coronavirus

As can be seen by Table 3, our algorithm provided all positive returns since coronavirus started affecting the US market. The S&P 500 benchmark was outperformed by every signal group for each short term horizon (3 days, 7 days, 14 days). Despite the benchmark index having negative returns throughout each time horizon, our algorithm’s long and short trading strategy provided consistent returns with the 14-day time horizon outperforming the index by the biggest margin, and the Top 5 signal group providing the highest return of 4.61% for the 14-day time horizon. As with Table 1, Table 3 shows that with each signal group, the returns increase. This shows that the algorithm gets progressively more accurate as it narrows down the best ETFs to trade.


According to Table 4, each signal group across every time horizon gave a hit ratio greater than 50%. More specifically, the signal groups and time horizons that gave the highest returns also showed the highest hit ratios. Per example, every signal group for the 14-day time horizon had hit ratios between 57-58%. This shows that the algorithm’s accuracy remained consistent and reliable despite being subject to the volatile and unpredictable Coronavirus period. The Top 20 and Top 10 signal groups both gave the highest hit ratio of 58% for the 14-day time horizon, as well as two of the highest returns.
Conclusion
This evaluation report presented the performance of I Know First’s algorithm for the Top ETFs forecast from January 1st, 2019 to May 24th, 2020. It shows the average returns and hit ratios for all time horizons, with further performance evaluation done on the turbulent period since the Coronavirus pandemic.
The I Know First algorithm has obtained better performance for short term horizons. It succeeded in outperforming the benchmark for all of them with only positive results. Even more so, it outperformed the index during the Coronavirus pandemic which saw the S&P 500 give negative returns. It is important to note that every signal group across every time horizon gave a hit ratio greater than 50%, showing a consistent and reliable accuracy. It is advisable for traders to rebalance their portfolio using the most updated forecasts sent by I Know First.
We look forward to new market data in the following months and will monitor the changes in performance trends that are going to be communicated to our investors and subscribers in the follow-up reports.


