
Turkish Stocks Based on Stock Market Algorithm: Returns up to 68.8% in 3 Months
Turkish Stocks
This forecast is part of the By Country Package, as one of I Know First’s algorithmic trading tools. The full forecast includes daily predictions for a total of 20 Turkish stocks with bullish and bearish signals:
- Top 10 Turkish stocks for the long position
- Top 10 Turkish stocks for the short position
Package Name: Turkish Stocks
Recommended Positions: Long
Forecast Length: 3 Months (5/21/2019 – 8/21/2019)
I Know First Average: 26.67%
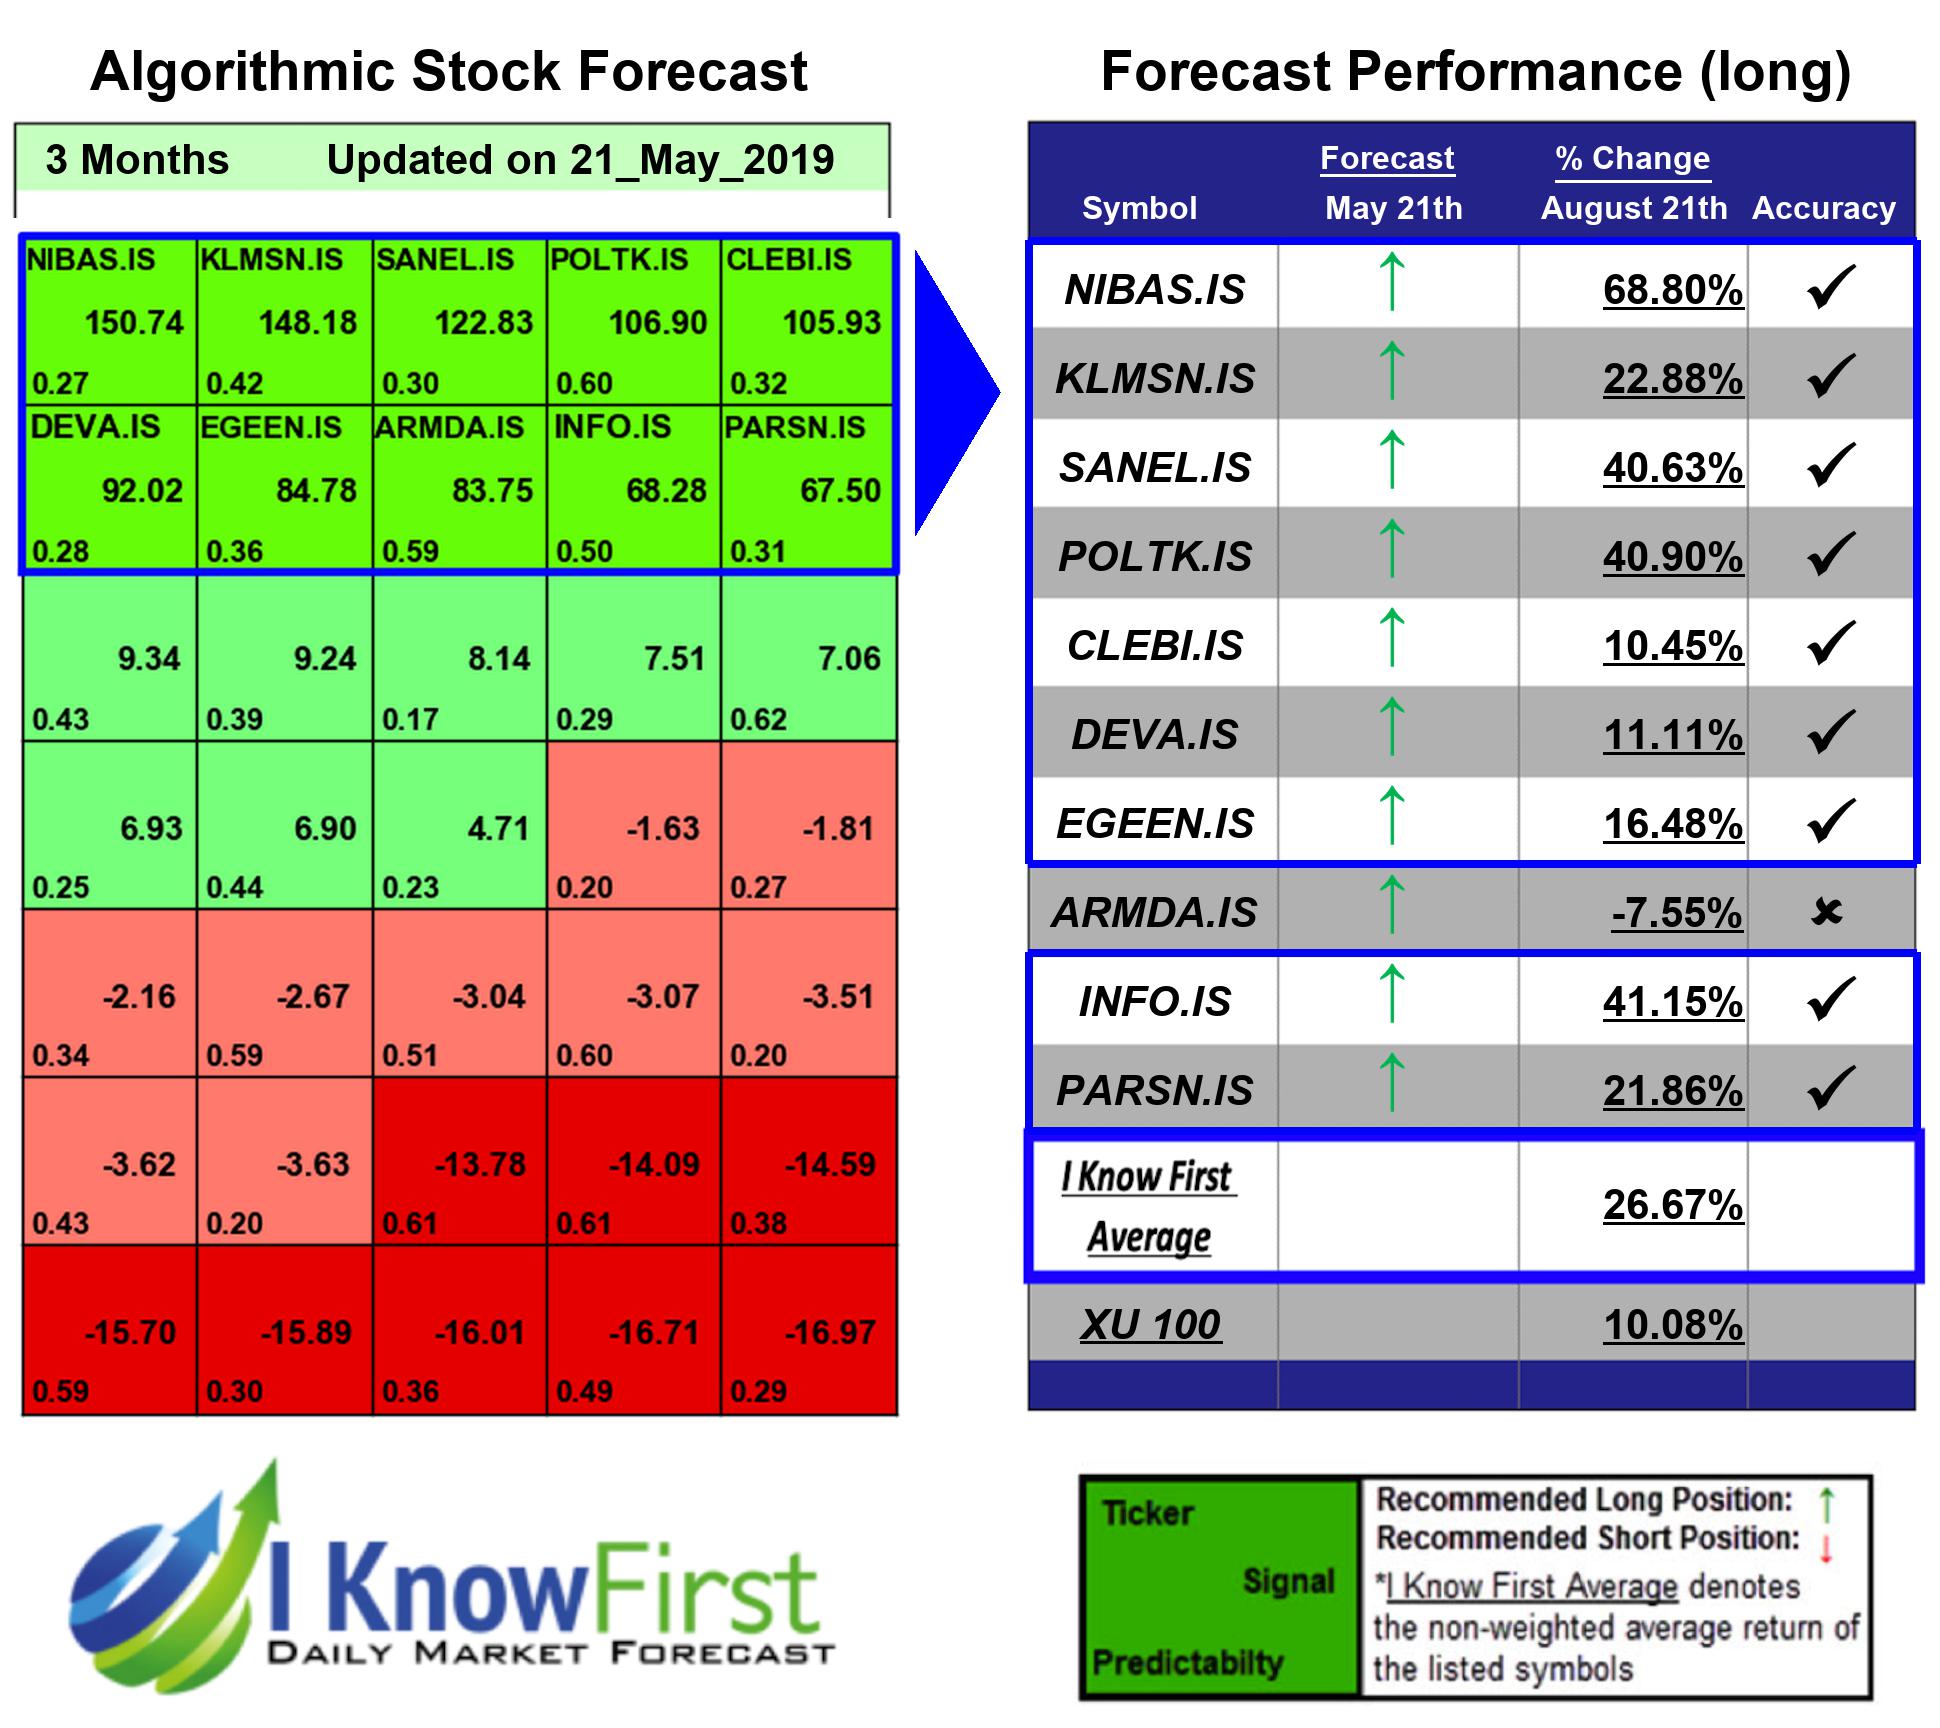

I Know First’s State of the Art Algorithm accurately forecasted 9 out of 10 trades in this Turkish Stocks Package for the 3 Months time period. The prediction with the highest return was NIBAS.IS, at 68.8%. INFO.IS and POLTK.IS also performed well for this time horizon with returns of 41.15% and 40.9%, respectively. The package had an overall average return of 26.67%, providing investors with a 16.59% premium over the XU 100 return of 10.08% during the period.
Nigbas Nigde Beton Sanayii ve Ticaret AS (Nigbas) is a Turkey-based engineering firm. The Company offers wide range of products including prestressed beams for bridges, poles, paving stones. Nigbas is also engaged in the production and distribution of ready-mix concrete.
Algorithmic traders utilize these daily forecasts by the I Know First market prediction system as a tool to enhance portfolio performance, verify their own analysis and act on market opportunities faster. This forecast was sent to current I Know First subscribers.
How to interpret this diagram
Algorithmic Stock Forecast: The table on the left is a stock forecast produced by I Know First’s algorithm. Each day, subscribers receive forecasts for six different time horizons. Note that the top 10 stocks in the 1-month forecast may be different than those in the 1-year forecast. In the included table, only the relevant stocks have been included. The boxes are arranged according to their respective signal and predictability values (see below for detailed definitions). A green box represents a positive forecast, suggesting a long position, while a red represents a negative forecast, suggesting a short position.
Please note-for trading decisions use the most recent forecast. Get today’s forecast and Top stock picks.


