
Top Stocks Based on Genetic Algorithms: Returns up to 10.97% in 3 Days
Top Stocks
This forecast is part of the Top 10 Stocks Package, as one of I Know First’s systematic trading tools. The full package includes a daily prediction for a total of 20 stocks with bullish and bearish signals:
- Top 10 stocks pick for the long position
- Top 10 stocks pick for the short position
![]()
![]()
Package Name: Stock Forecast & S&P500 Forecast
Recommended Positions: Long
Forecast Length: 3 Days (2/3/2020 – 2/6/2020)
I Know First Average: 4.36%

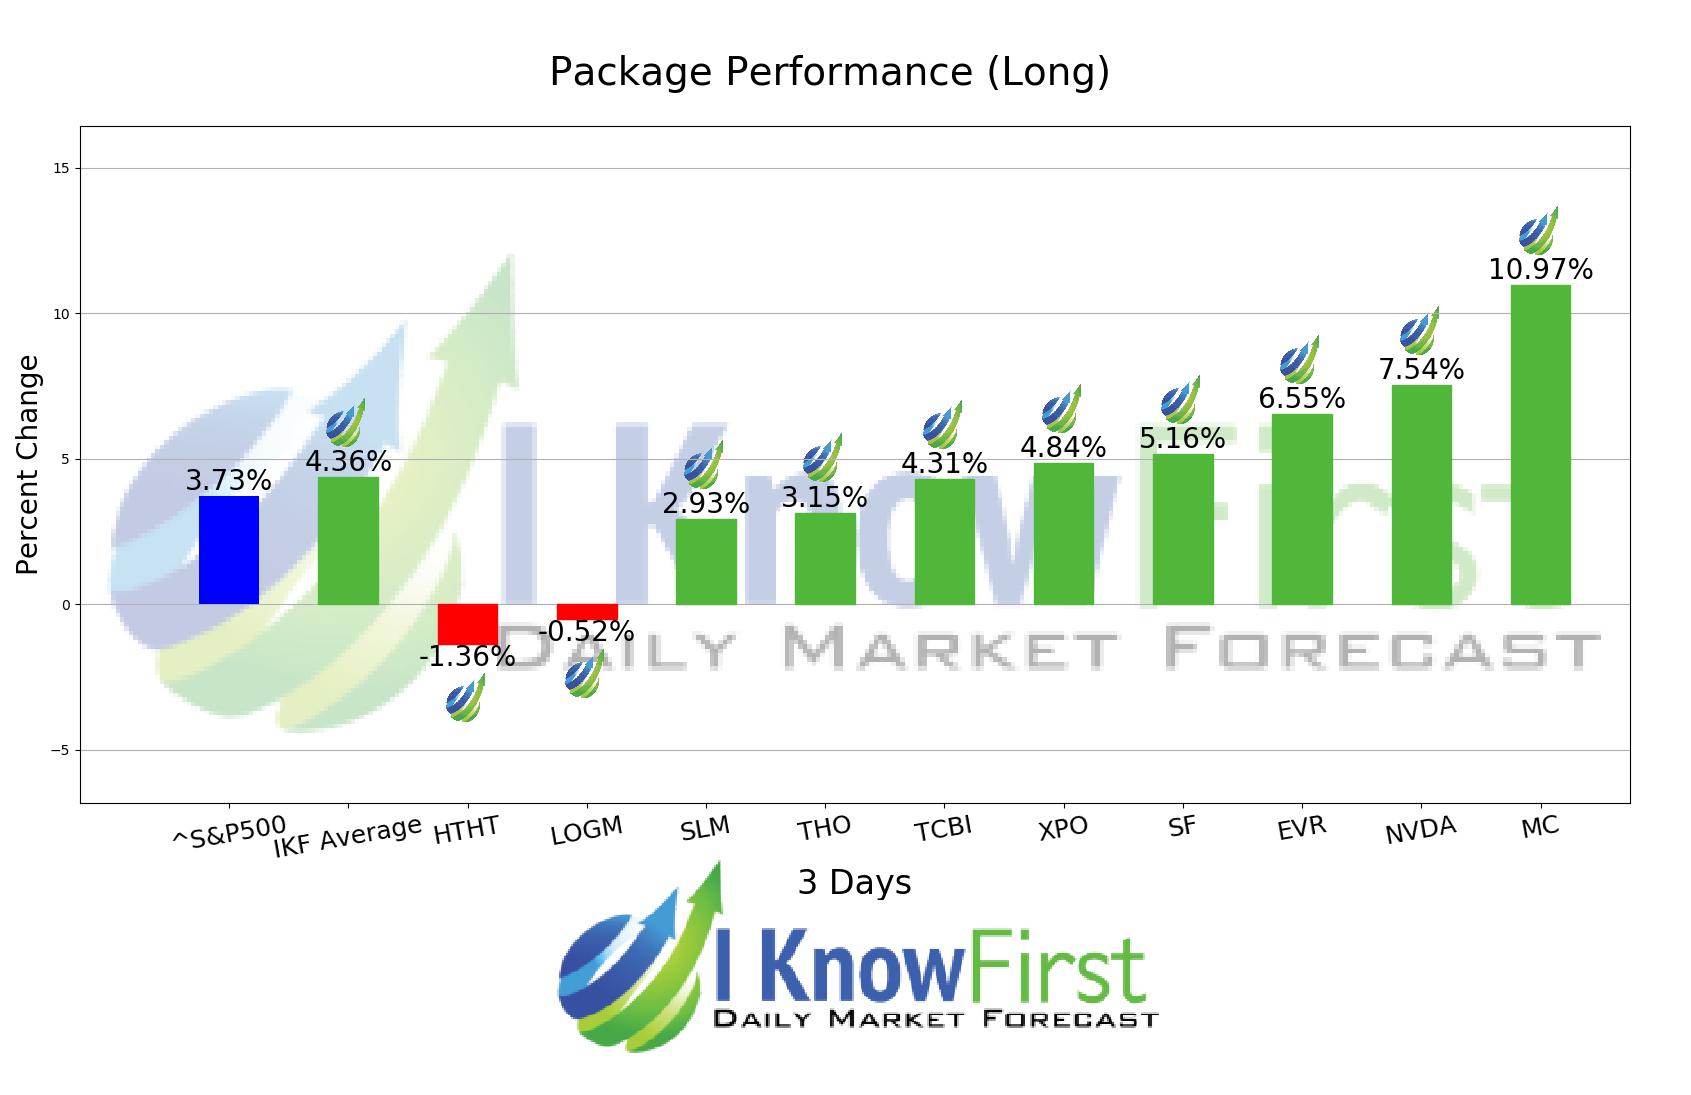
Several predictions in this 3 Days forecast saw significant returns. The algorithm had correctly predicted 8 out 10 stock movements. MC was our best stock pick this week a return of 10.97%. NVDA and EVR followed with returns of 7.54% and 6.55% for the 3 Days period. The Stock Forecast & S&P500 Forecast package had an overall average return of 4.36%, providing investors with a premium of 0.63% over the S&P 500’s return of 3.73%.
Moelis & Company (MC) provides strategic and financial advisory services in the United States and internationally. The company advises clients in the areas of mergers and acquisitions, recapitalizations and restructurings, and other corporate finance matters. Moelis & Company (MC) offers its services to public multinational corporations, governments, financial sponsors, middle market private companies, and individual entrepreneurs. The company was founded in 2007 and is based in New York, New York.
Algorithmic traders utilize these daily forecasts by the I Know First market prediction system as a tool to enhance portfolio performance, verify their own analysis and act on market opportunities faster. This forecast was sent to current I Know First subscribers.
How to interpret this diagram
Algorithmic Stock Forecast: The table on the left is a stock forecast produced by I Know First’s algorithm. Each day, subscribers receive forecasts for six different time horizons. Note that the top 10 stocks in the 1-month forecast may be different than those in the 1-year forecast. In the included table, only the relevant stocks have been included. The boxes are arranged according to their respective signal and predictability values (see below for detailed definitions). A green box represents a positive forecast, suggesting a long position, while a red represents a negative forecast, suggesting a short position.
Please note-for trading decisions use the most recent forecast. Get today’s forecast and Top stock picks.


