
Top S&P 500 Stocks Based on Predictive Analytics: Returns up to 13.32% in 14 Days
Top S&P 500 Stocks
This top S&P 500 stocks forecast is designed for investors and analysts who need predictions for the whole S&P 500 (See S&P 500 Companies Package). It includes 20 stocks with bullish and bearish signals and indicates the best S&P 500 Companies stocks to buy:
- Top 10 S&P 500 stocks for the long position
- Top 10 S&P 500 stocks for the short position

Package Name: Top S&P 500 Stocks
Recommended Positions: Long
Forecast Length: 14 Days (8/25/2020 – 9/8/2020)
I Know First Average: 2.35%

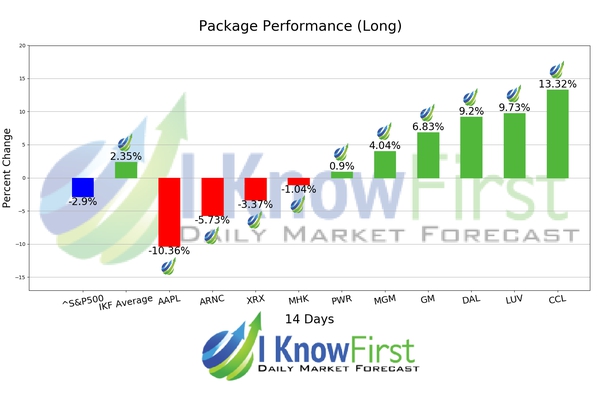
6 out of 10 stock prices in this forecast for the Top S&P 500 Stocks Package moved as predicted by the algorithm. The prediction with the highest return was CCL, at 13.32%. LUV and DAL also performed well for this time horizon with returns of 9.73% and 9.2%, respectively. The package had an overall average return of 2.35%, providing investors with a 5.25% premium over the S&P 500’s return of -2.9% during the period.
Carnival Corporation (CCL) operates as a leisure travel and cruise company in North America, Europe, Australia, and Asia. It offers cruises under the Carnival Cruise Line, Princess Cruises, Holland America Line, and Seabourn brands in North America; and Costa, AIDA, P&O; Cruises (UK), Cunard, and P&O; Cruises (Australia) brands in Europe, Australia, and Asia. The company operates 99 cruise ships. It also owns Holland America Princess Alaska Tours, a tour company in Alaska and the Canadian Yukon, which owns and operates 11 hotels or lodges, approximately 300 motor coaches, and 20 glass-domed railcars. In addition, the company is involved in the leasing of cruise ships. It sells its cruises primarily through travel agents and tour operators. Carnival Corporation (CCL) was incorporated in 1972 and is headquartered in Miami, Florida. Carnival Corporation (CCL) operates as a subsidiary of Carnival Corporation & Plc.
Algorithmic traders utilize these daily forecasts by the I Know First market prediction system as a tool to enhance portfolio performance, verify their own analysis and act on market opportunities faster. This forecast was sent to current I Know First subscribers.
How to interpret this diagram
Algorithmic Stock Forecast: The table on the left is a stock forecast produced by I Know First’s algorithm. Each day, subscribers receive forecasts for six different time horizons. Note that the top 10 stocks in the 1-month forecast may be different than those in the 1-year forecast. In the included table, only the relevant stocks have been included. The boxes are arranged according to their respective signal and predictability values (see below for detailed definitions). A green box represents a positive forecast, suggesting a long position, while a red represents a negative forecast, suggesting a short position.
Please note-for trading decisions use the most recent forecast. Get today’s forecast and Top stock picks.


