
Top Pharma Stocks Based on Data Mining: Returns up to 70.18% in 3 Months
Top Pharma Stocks
This stock forecast is designed for investors and analysts who need predictions of the best stocks for the whole Pharmaceutical sector (see Pharma Stocks Package). It includes 20 stocks with bullish and bearish signals and indicates the best pharmaceutical stocks to trade:
- Top 10 Pharmaceutical stocks for the long position
- Top 10 Pharmaceutical stocks for the short position

Package Name: Pharma Stocks Forecast
Recommended Positions: Long
Forecast Length: 3 Months (4/8/2020 – 7/8/2020)
I Know First Average: 46.33%

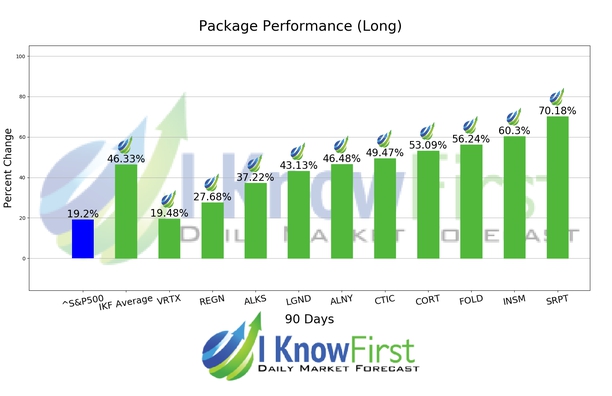
For this 3 Months forecast the algorithm had successfully predicted 10 out of 10 movements. The top-performing prediction in this forecast was SRPT, which registered a return of 70.18%. Further notable returns came from INSM and FOLD at 60.3% and 56.24%, respectively. The package itself saw an overall return of 46.33%, providing investors with a 27.13% premium above the S&P 500’s return of 19.2% for the same time period.
Sarepta Therapeutics, Inc. (SRPT) is a biopharmaceutical company focusing on the discovery and development of RNA-based therapeutics for the treatment of rare, infectious, and other diseases. Its lead product candidate is Eteplirsen. The company was founded in 1890 and is headquartered in Cambridge, United Kingdom.
Algorithmic traders utilize these daily forecasts by the I Know First market prediction system as a tool to enhance portfolio performance, verify their own analysis and act on market opportunities faster. This forecast was sent to current I Know First subscribers.
How to interpret this diagram
Algorithmic Stock Forecast: The table on the left is a stock forecast produced by I Know First’s algorithm. Each day, subscribers receive forecasts for six different time horizons. Note that the top 10 stocks in the 1-month forecast may be different than those in the 1-year forecast. In the included table, only the relevant stocks have been included. The boxes are arranged according to their respective signal and predictability values (see below for detailed definitions). A green box represents a positive forecast, suggesting a long position, while a red represents a negative forecast, suggesting a short position.
Please note-for trading decisions use the most recent forecast. Get today’s forecast and Top stock picks.


