
Top Pharma Stocks Based on a Self-learning Algorithm: Returns up to 24.05% in 14 Days
Top Pharma Stocks
This stock forecast is designed for investors and analysts who need predictions of the best stocks for the whole Pharmaceutical sector (see Pharma Stocks Package). It includes 20 stocks with bullish and bearish signals and indicates the best pharmaceutical stocks to trade:
- Top 10 Pharmaceutical stocks for the long position
- Top 10 Pharmaceutical stocks for the short position

Package Name: Pharma Stocks Forecast
Recommended Positions: Long
Forecast Length: 14 Days (10/11/2020 – 10/26/2020)
I Know First Average: 3.89%
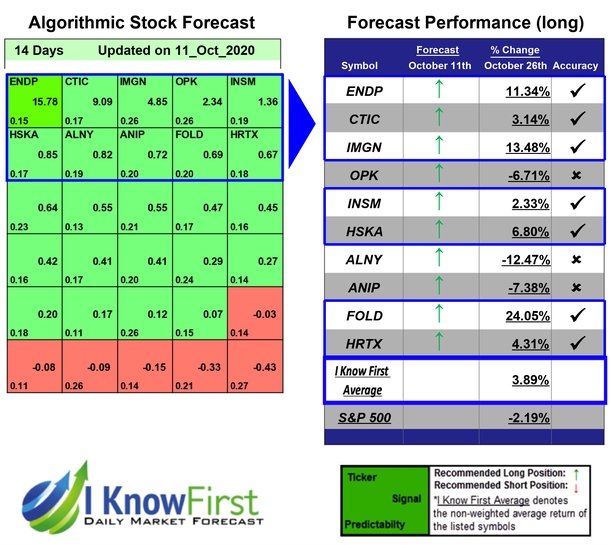
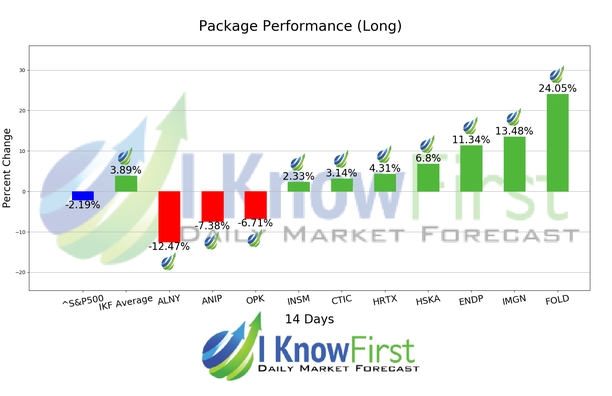
This Pharma Stocks Forecast Package forecast had correctly predicted 7 out of 10 stock movements. FOLD was the highest-earning trade with a return of 24.05% in 14 Days. IMGN and ENDP saw outstanding returns of 13.48% and 11.34%. The overall average return in this Pharma Stocks Forecast package was 3.89%, providing investors with a 6.08% premium over the S&P 500’s return of -2.19% during the same period.
Amicus Therapeutics, Inc., a biotechnology company, engages in the discovery, development, and commercialization of medicines for various rare and orphan diseases. Its principal product is the migalastat HCl, an orally administered small molecule pharmacological chaperone for the treatment of Fabry disease, which has completed two global Phase III registration studies.
Algorithmic traders utilize these daily forecasts by the I Know First market prediction system as a tool to enhance portfolio performance, verify their own analysis and act on market opportunities faster. This forecast was sent to current I Know First subscribers.
How to interpret this diagram
Algorithmic Stock Forecast: The table on the left is a stock forecast produced by I Know First’s algorithm. Each day, subscribers receive forecasts for six different time horizons. Note that the top 10 stocks in the 1-month forecast may be different than those in the 1-year forecast. In the included table, only the relevant stocks have been included. The boxes are arranged according to their respective signal and predictability values (see below for detailed definitions). A green box represents a positive forecast, suggesting a long position, while a red represents a negative forecast, suggesting a short position.
Please note-for trading decisions use the most recent forecast. Get today’s forecast and Top stock picks.


