
Top Biotech Stocks Based on Stock Algorithm: Returns up to 37.4% in 14 Days
Top Biotech Stocks
The BioTech Stocks Package is designed for investors and analysts who need predictions of the best stocks to buy for the whole Biotechnology Industry. It includes 20 stocks with bullish and bearish signals and indicates the best biotech stocks to trade:
- Top 10 Biotech stocks for the long position
- Top 10 Biotech stocks for the short position

Package Name: Biotech Stocks Forecast
Recommended Positions: Long
Forecast Length: 14 Days (9/3/2019 – 9/17/2019)
I Know First Average: 13.39%
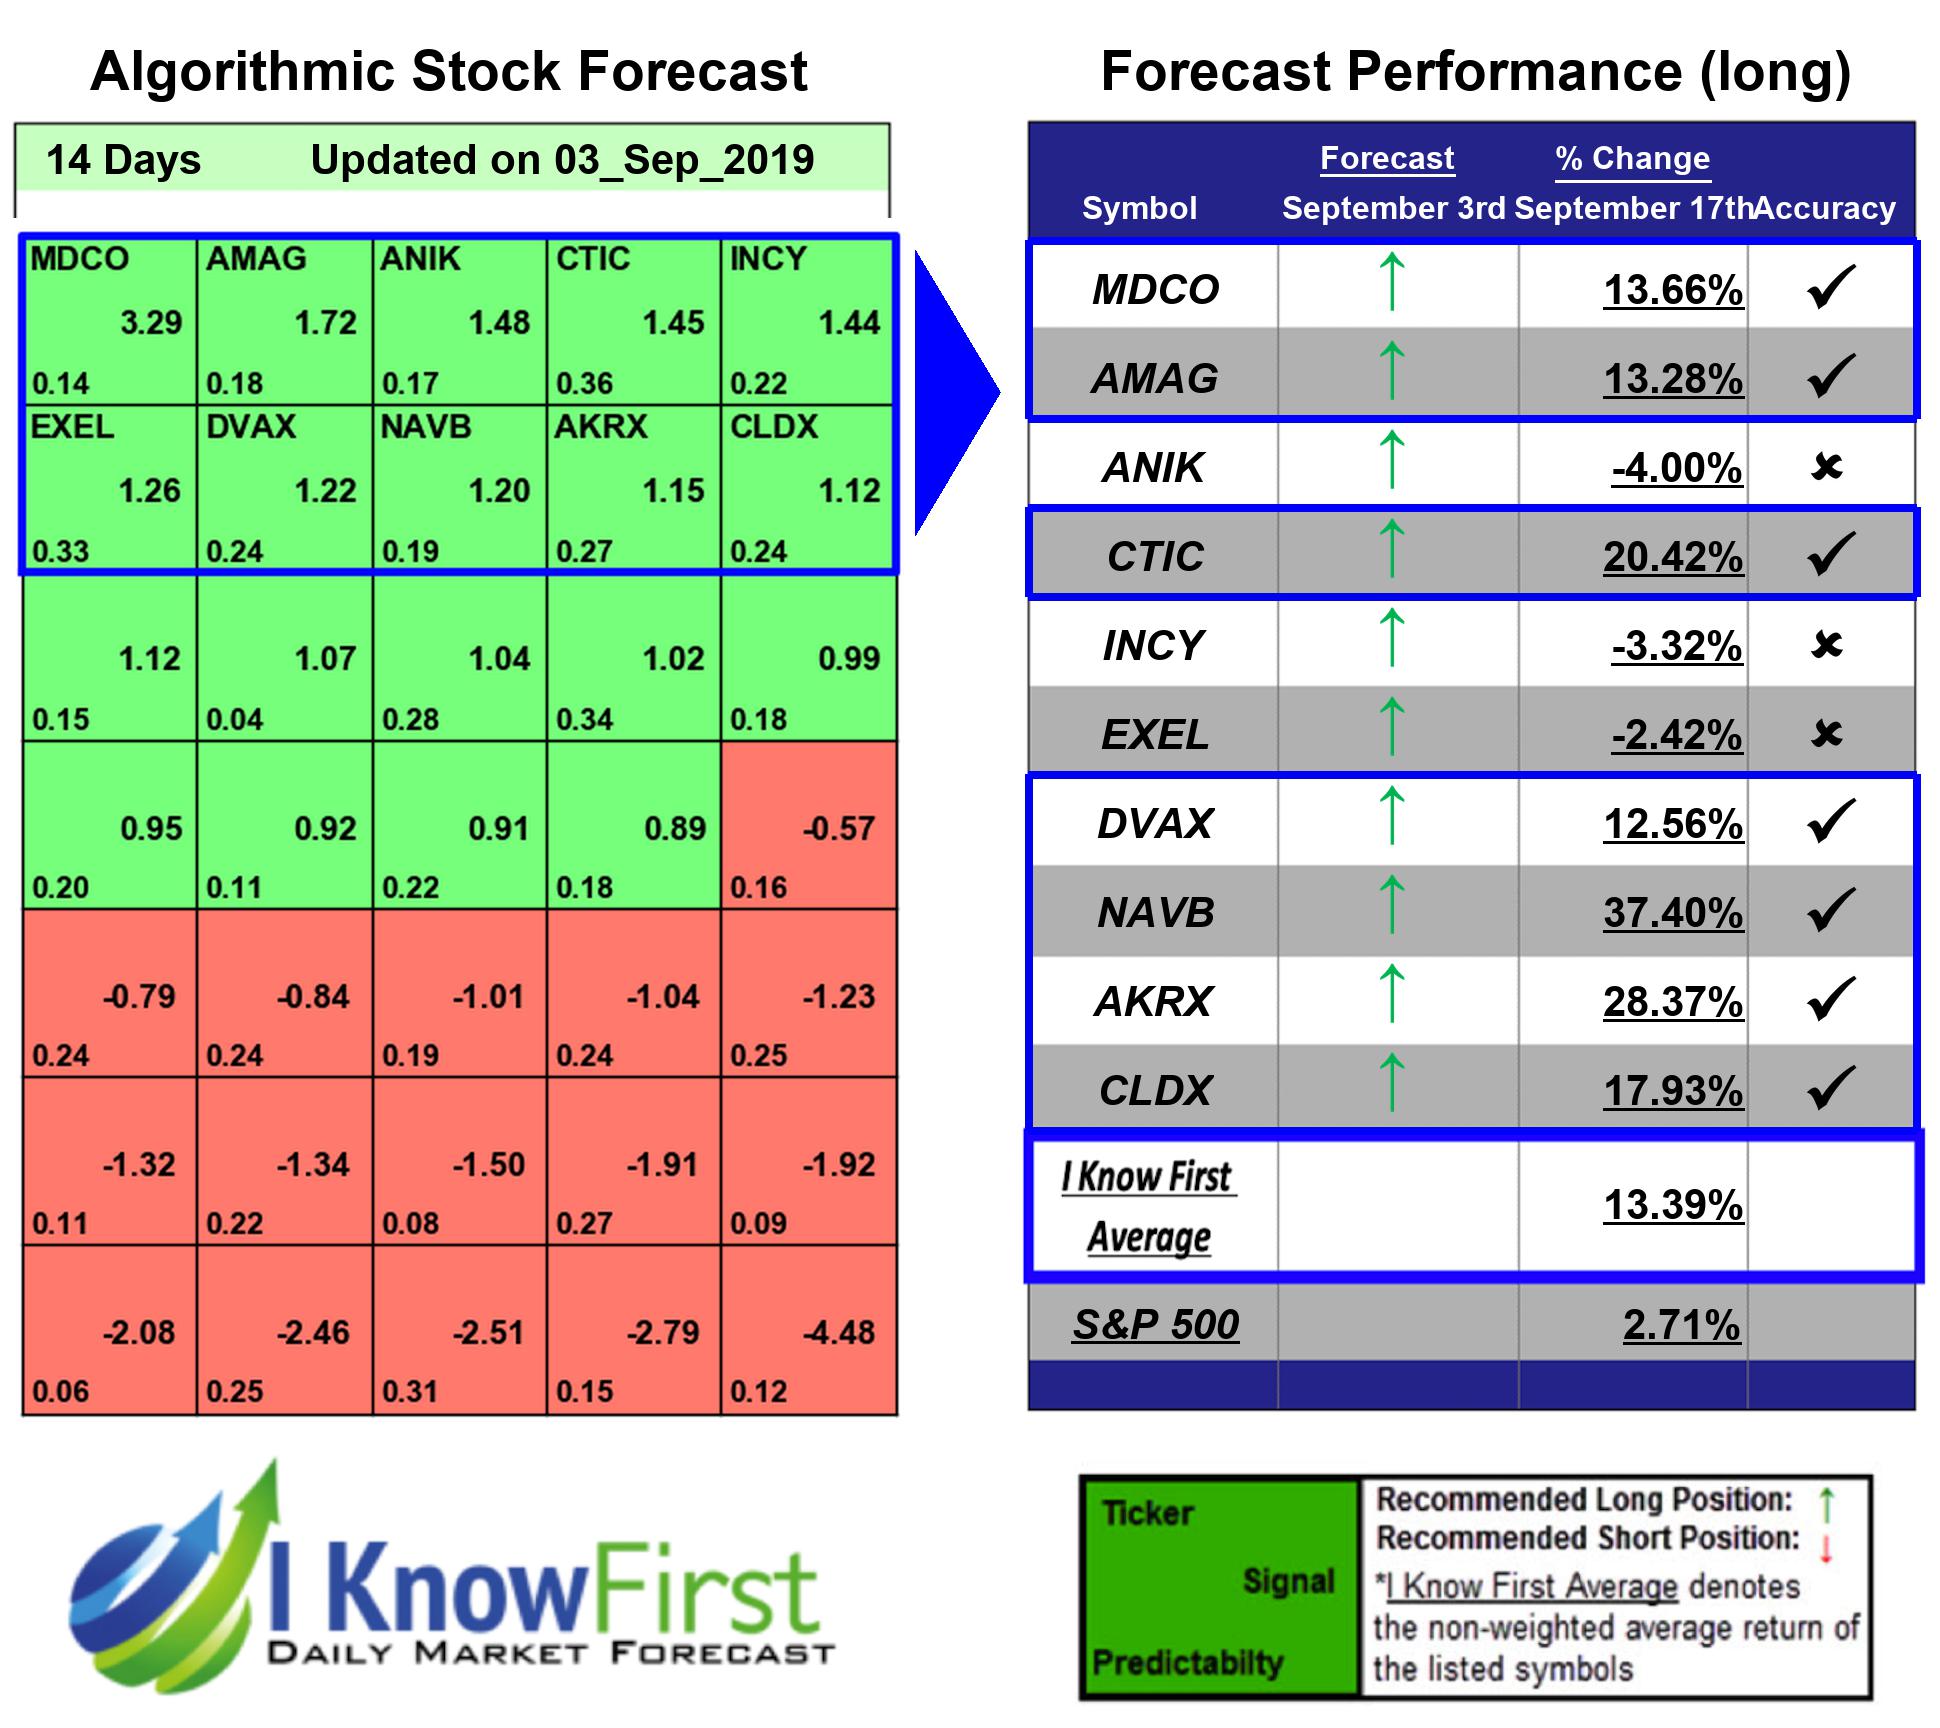

During the 14 Days forecasted period several picks in the Biotech Stocks Forecast Package saw significant returns. The algorithm had correctly predicted 7 out 10 returns. The greatest return came from NAVB at 37.4%. AKRX and CTIC also performed well for this time horizon with returns of 28.37% and 20.42%, respectively. The package itself saw an overall return of 13.39%, providing investors with a 10.68% premium above the S&P 500’s return of 2.71% for the same time period.
Navidea Biopharmaceuticals, Inc. (NAVB) is a biopharmaceuticals company headquartered in Dublin, Ohio. The company develops and commercializes precision immunodiagnostic agents and immunotherapeutics.
Algorithmic traders utilize these daily forecasts by the I Know First market prediction system as a tool to enhance portfolio performance, verify their own analysis and act on market opportunities faster. This forecast was sent to current I Know First subscribers.
How to interpret this diagram
Algorithmic Stock Forecast: The table on the left is a stock forecast produced by I Know First’s algorithm. Each day, subscribers receive forecasts for six different time horizons. Note that the top 10 stocks in the 1-month forecast may be different than those in the 1-year forecast. In the included table, only the relevant stocks have been included. The boxes are arranged according to their respective signal and predictability values (see below for detailed definitions). A green box represents a positive forecast, suggesting a long position, while a red represents a negative forecast, suggesting a short position.
Please note-for trading decisions use the most recent forecast. Get today’s forecast and Top stock picks.


