
Tech Stocks To Buy Based on Artificial Intelligence: Returns up to 28.84% in 1 Month
Tech Stocks To Buy
This Tech Stock forecast is based on stock picking strategies for investors and analysts who need predictions for the 10 best tech stocks in the Technology Industry (see Tech Stocks Package). It includes 20 stocks with bullish and bearish signals and indicates the best tech stocks to buy:
- Top 10 Tech stocks for the long position
- Top 10 Tech stocks for the short position
Package Name: Tech Stocks Forecast
Recommended Positions: Long
Forecast Length: 1 Month (10/15/2019 – 11/15/2019)
I Know First Average: 12.8%
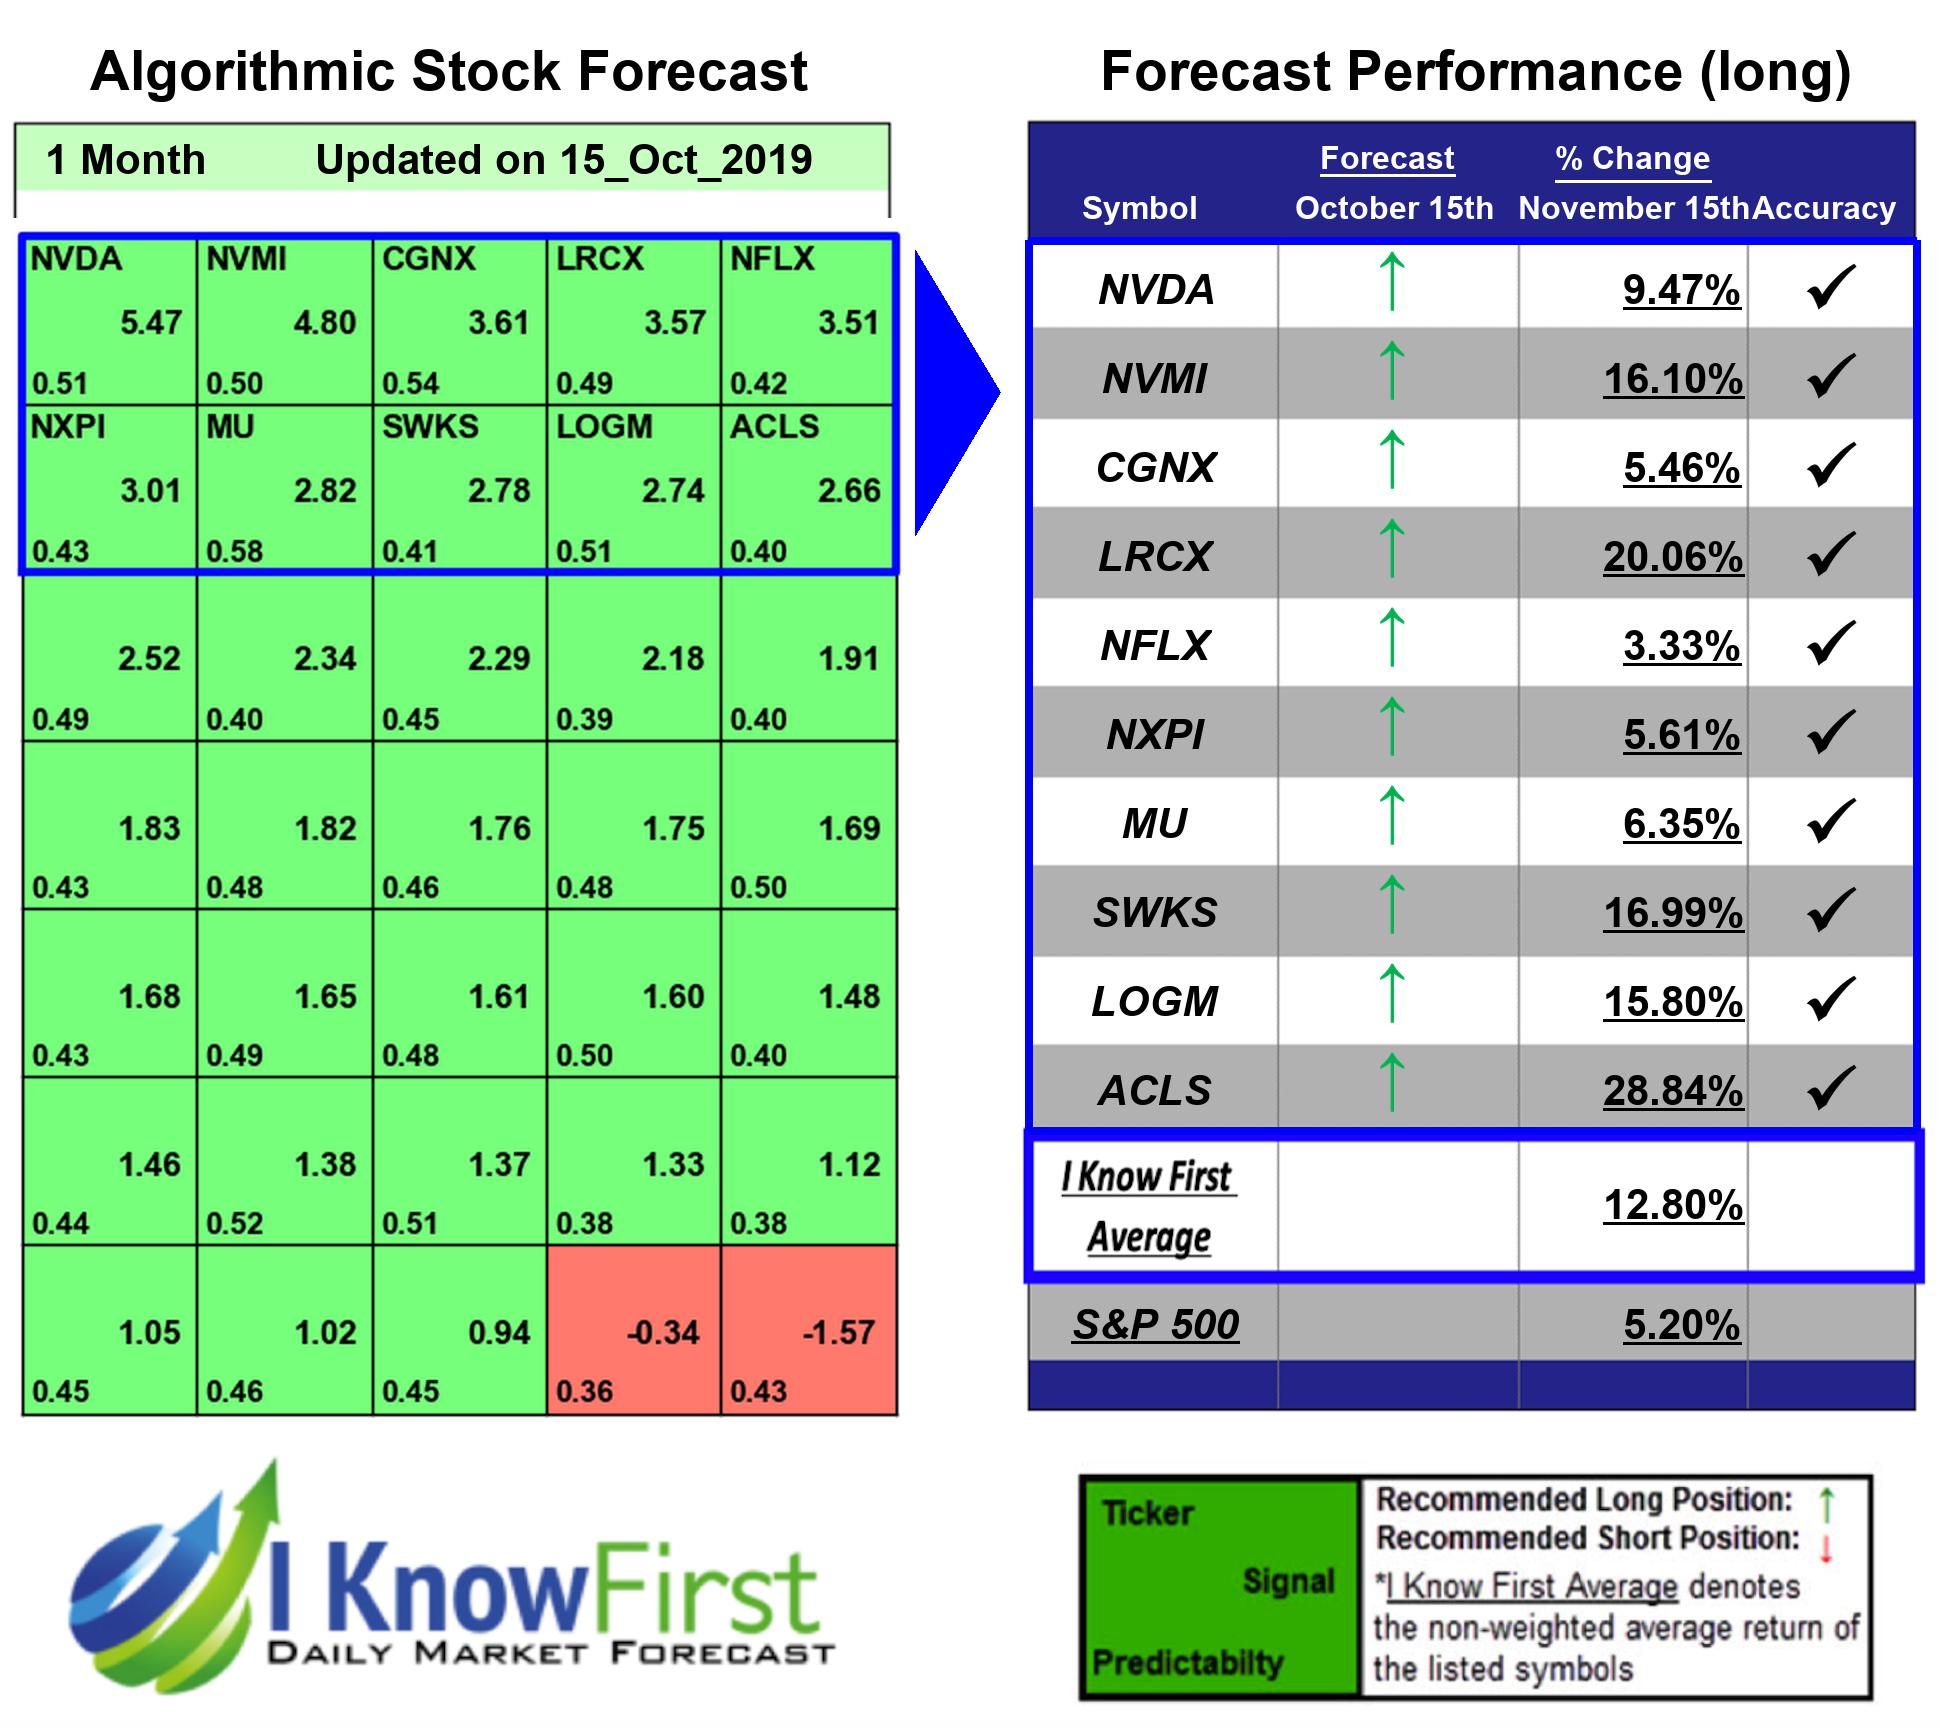
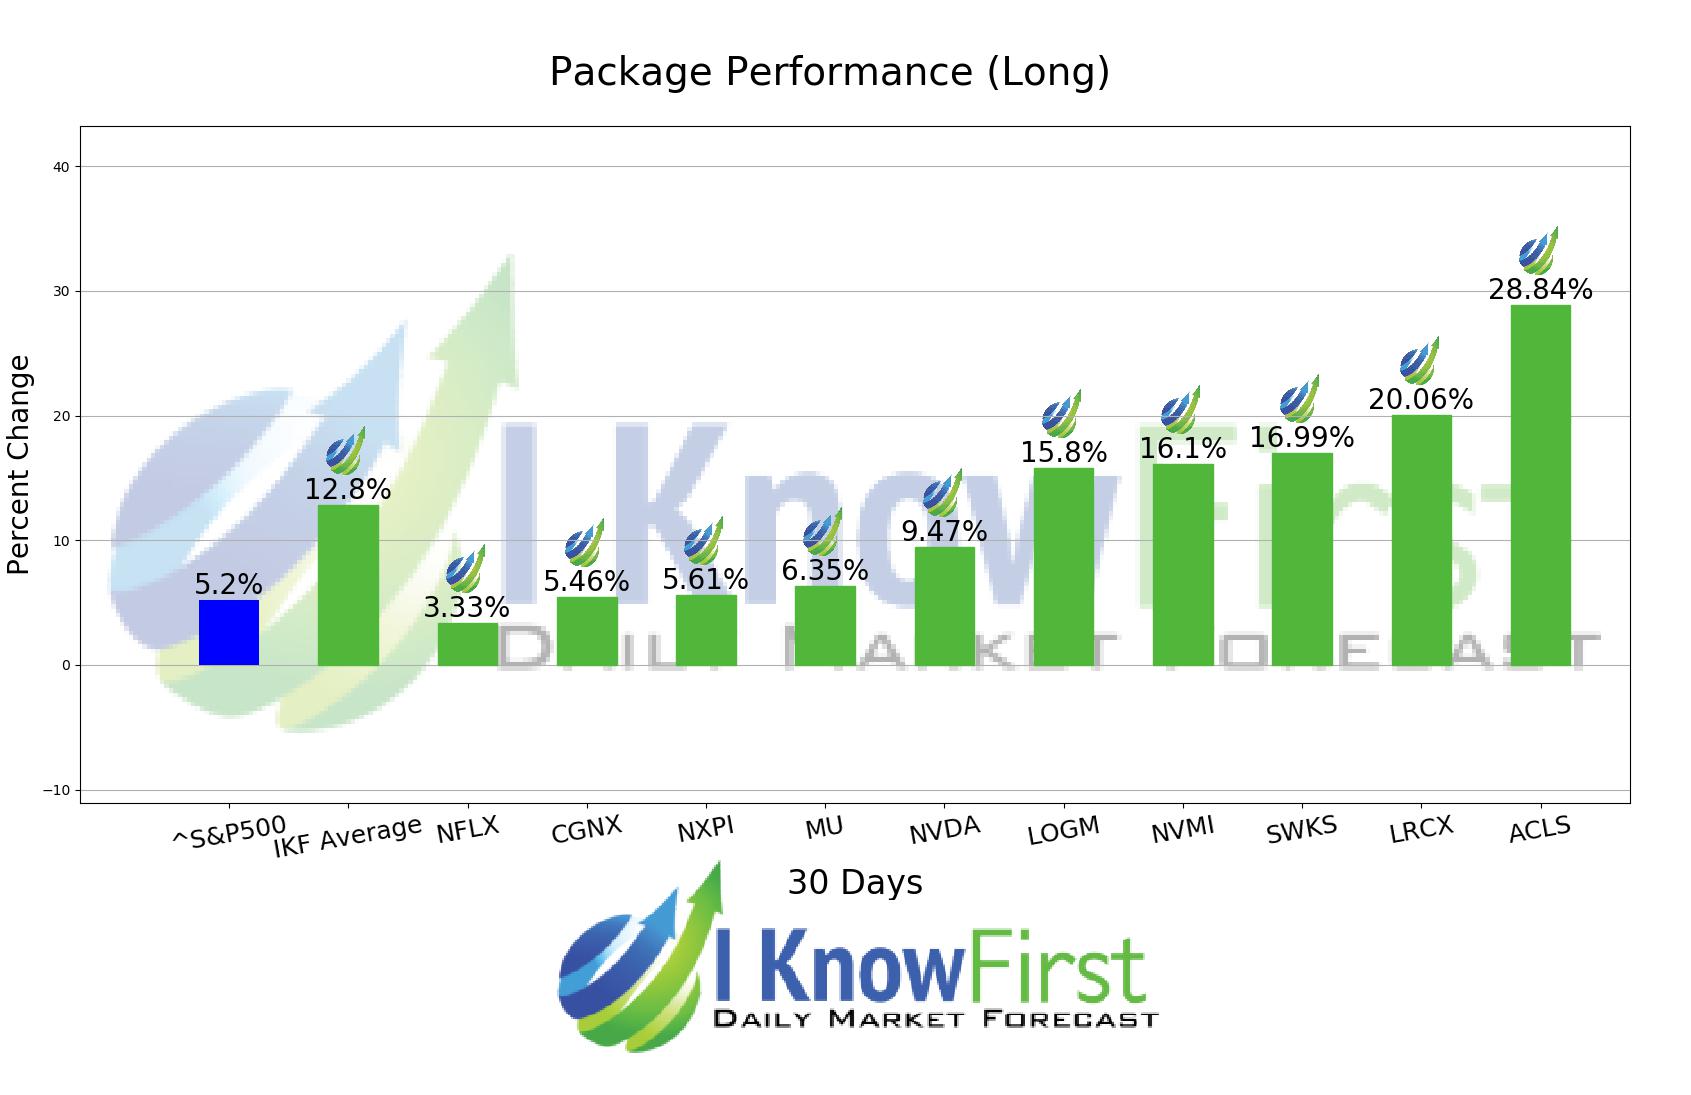
I Know First’s State of the Art Algorithm accurately forecasted 10 out of 10 trades in this Tech Stocks Forecast Package for the 1 Month time period. The prediction with the highest return was ACLS, at 28.84%. Further notable returns came from LRCX and SWKS at 20.06% and 16.99%, respectively. The overall average return in this Tech Stocks Forecast package was 12.8%, providing investors with a 7.60% premium over the S&P 500’s return of 5.2% during the same period.
Axcelis Technologies, Inc. designs, manufactures, and services ion implantation and other processing equipment used in the fabrication of semiconductor chips in the United States, Europe, and the Asia Pacific.
Algorithmic traders utilize these daily forecasts by the I Know First market prediction system as a tool to enhance portfolio performance, verify their own analysis and act on market opportunities faster. This forecast was sent to current I Know First subscribers.
How to interpret this diagram
Algorithmic Stock Forecast: The table on the left is a stock forecast produced by I Know First’s algorithm. Each day, subscribers receive forecasts for six different time horizons. Note that the top 10 stocks in the 1-month forecast may be different than those in the 1-year forecast. In the included table, only the relevant stocks have been included. The boxes are arranged according to their respective signal and predictability values (see below for detailed definitions). A green box represents a positive forecast, suggesting a long position, while a red represents a negative forecast, suggesting a short position.
Please note-for trading decisions use the most recent forecast. Get today’s forecast and Top stock picks.


