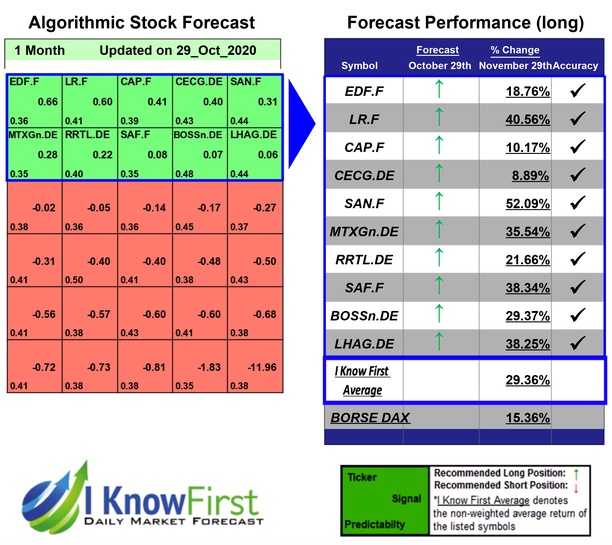
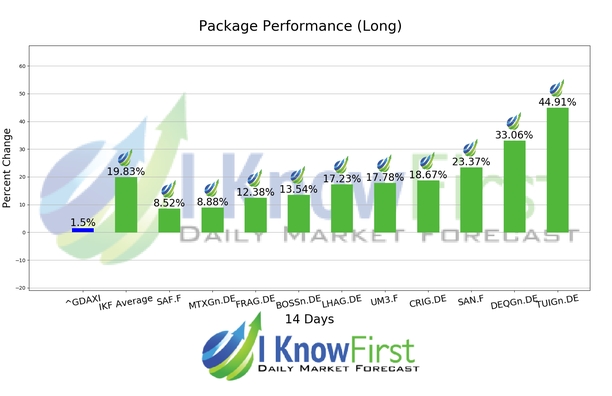
Best German Stocks Based on a Self-learning Algorithm: Returns up to 39.28% in 14 Days
Package Name: By Country - German Stocks
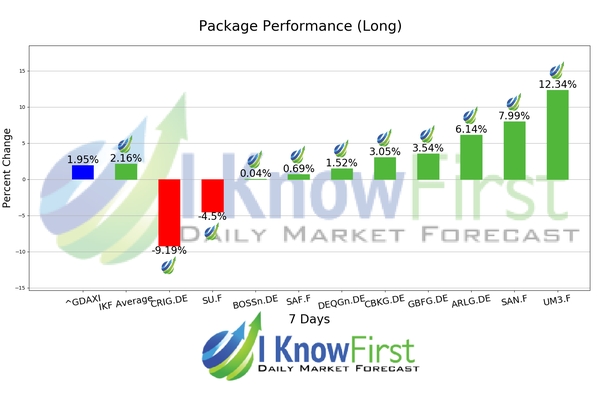
Recommended Positions: Long
Forecast Length: 14 Days (12/15/20 - 12/29/20)
I Know First Average: 4.61%
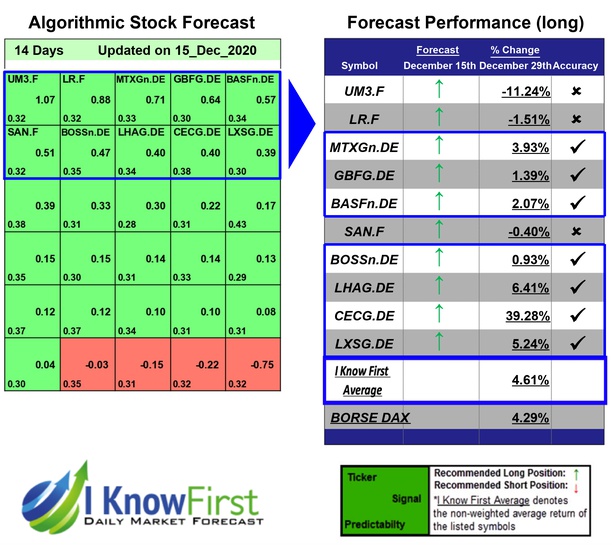


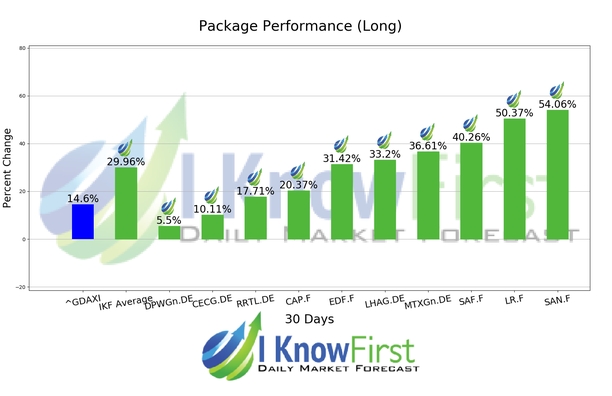
Recommended Positions: Long
Forecast Length: 14 Days (12/15/20 - 12/29/20)
I Know First Average: 4.61%
Read The Full Forecast