Home Builders Stocks Based on Algo Trading: Returns up to 27.49% in 1 Month
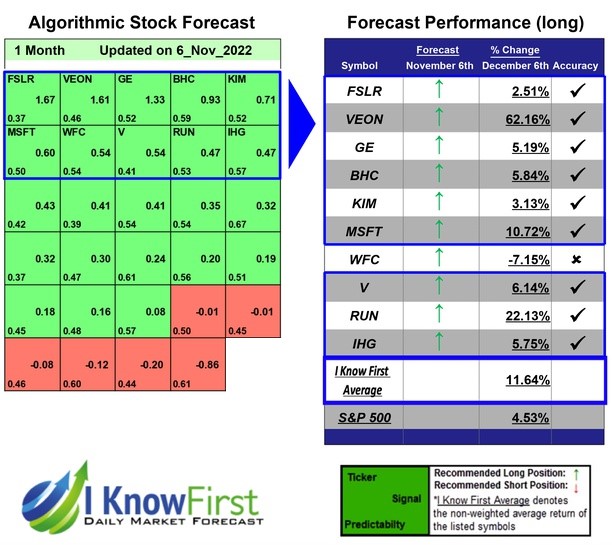
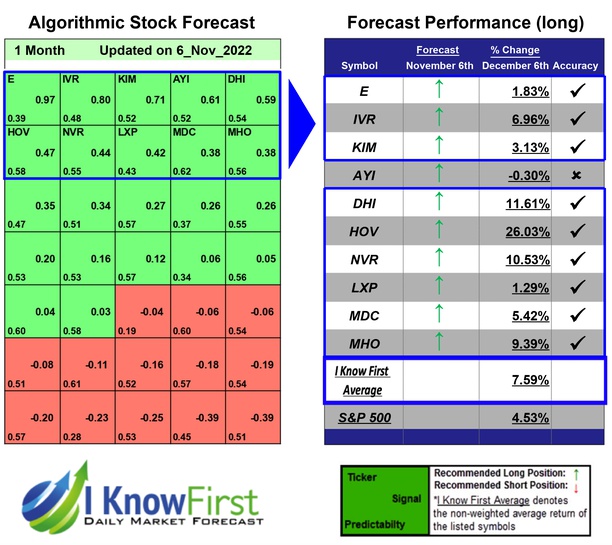
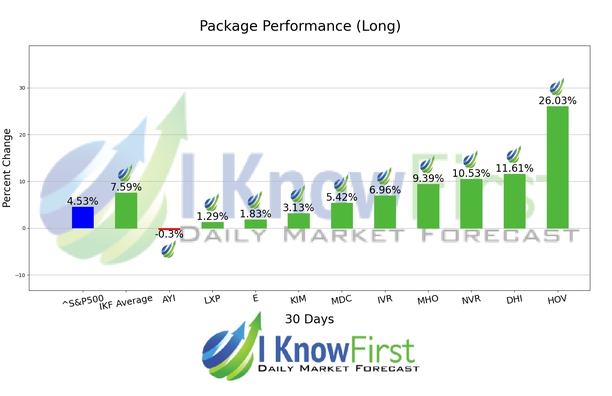
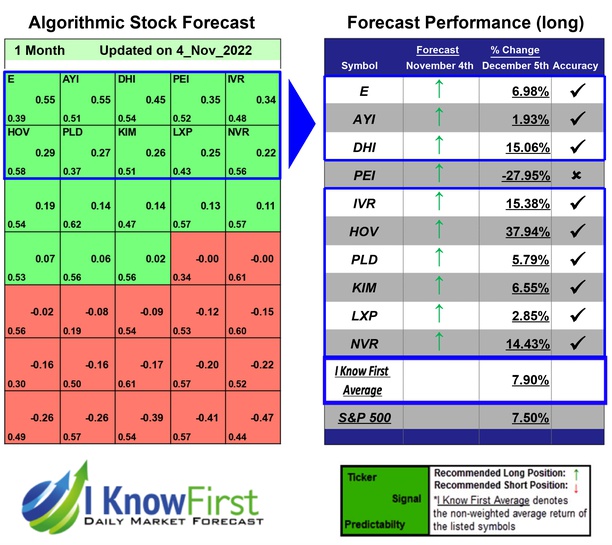
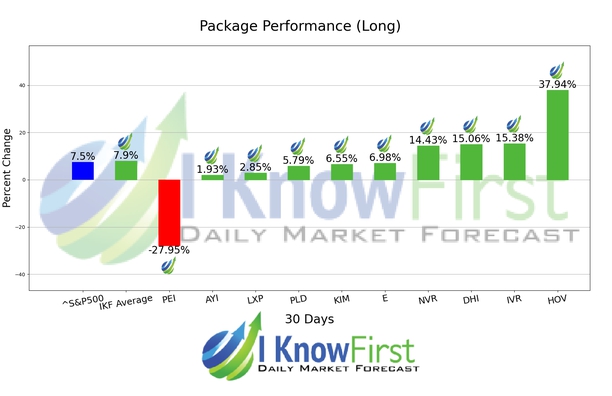
Package Name: Home Builders
Recommended Positions: Long
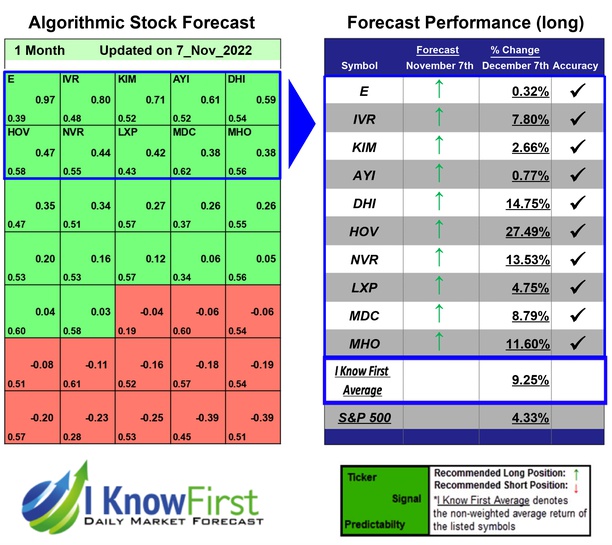
Forecast Length: 1 Month (11/7/22 - 12/7/22)
I Know First Average: 9.25%


Recommended Positions: Long
Forecast Length: 1 Month (11/7/22 - 12/7/22)
I Know First Average: 9.25%
Read The Full Forecast