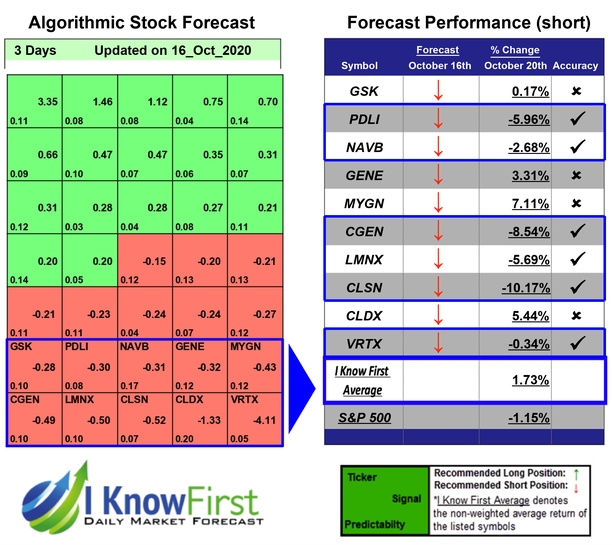
Biotech Stocks Based on Pattern Recognition: Returns up to 10.17% in 3 Days
 Package Name: Biotech Stocks Forecast
Recommended Positions: Short
Forecast Length: 3 Days (10/16/2020 - 10/20/2020)
I Know First Average: 1.73%
Read The Full Forecast

 Package Name: Biotech Stocks Forecast
  Package Name: Medicine Stocks
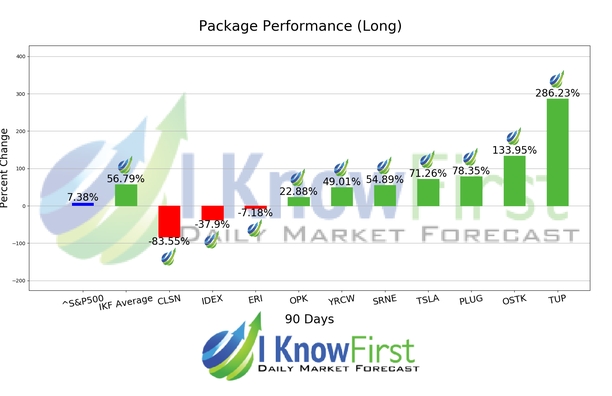
 Package Name: Biotech Stocks Forecast
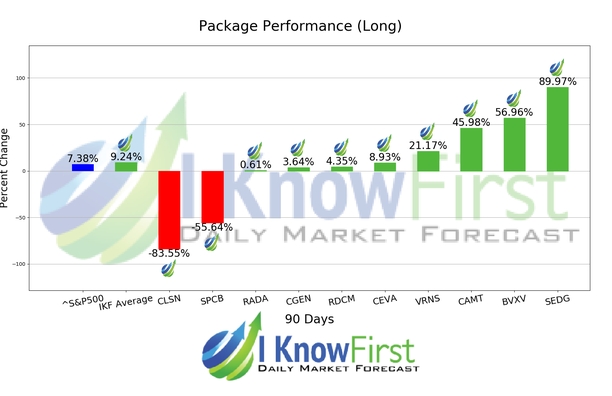
 Package Name: By Country - Israeli Stocks
 Package Name: By Country - Israeli Stocks
 Package Name: By Country - Israeli Stocks
 Package Name: Implied Volatility Options
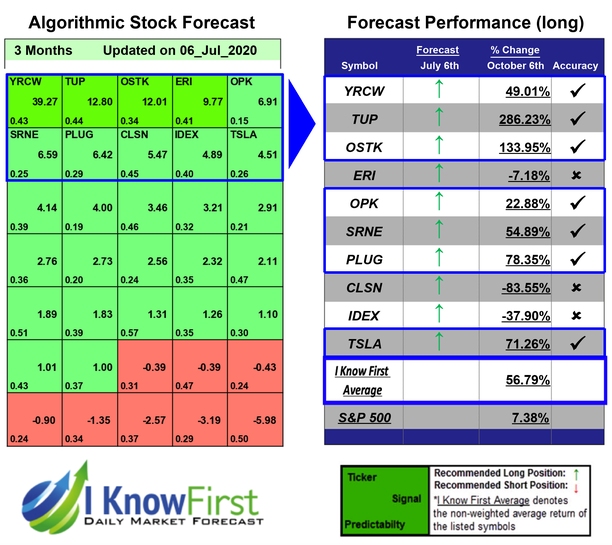


Disclaimer:
I Know First-Daily Market Forecast, does not provide personal investment or financial advice to individuals, or act as personal financial, legal, or institutional investment advisors, or individually advocate the purchase or sale of any security or investment or the use of any particular financial strategy. All investing, stock forecasts and investment strategies include the risk of loss for some or even all of your capital. Before pursuing any financial strategies discussed on this website, you should always consult with a licensed financial advisor.