
Swing Trading Based on Big Data Analytics: Returns up to 4.22% in 7 Days
Swing Trading
This Utilities Stocks forecast is designed for investors and analysts who need swing trading predictions of the best utilities stocks to buy for the whole Industry . It includes 10 stocks with bullish and bearish signals and indicates the best utilities stocks to buy:
- Top 10 Utilities stocks for the long position
- Top 10 Utilities stocks for the short position
Package Name: Utilities Stocks
Recommended Positions: Long
Forecast Length: 7 Days (8/10/21 – 8/17/21)
I Know First Average: 1.85%

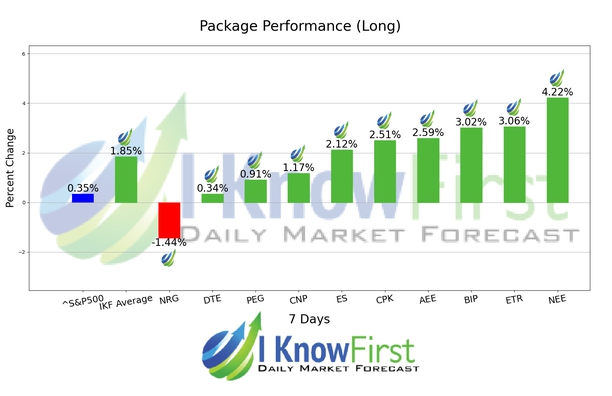
During the 7 Days forecasted period several picks in the Utilities Stocks Package saw significant returns. The algorithm had correctly predicted 9 out 10 returns. NEE was the top performing prediction with a return of 4.22%. Other notable stocks were ETR and BIP with a return of 3.06% and 3.02%. The package’s overall average return was 1.85%, providing investors with a 1.50% premium over the S&P 500’s return of 0.35% during the same period.
NextEra Energy, Inc. (NEE), through its subsidiaries, generates, transmits, and distributes electric energy in the United States and Canada. The company generates electricity from gas, oil, solar, coal, petroleum coke, nuclear, and wind sources. As of December 31, 2015, it served approximately 9.5 million people through approximately 4.8 million customer accounts in the east and lower west coasts of Florida. The company had approximately 46,400 megawatts of generating capacity. It also leases fiber-optic network capacity and dark fiber to telephone, wireless, and Internet companies. The company was formerly known as FPL Group, Inc. and changed its name to NextEra Energy, Inc. (NEE) in 2010. NextEra Energy, Inc. (NEE) was founded in 1984 and is headquartered in Juno Beach, Florida.
Algorithmic traders utilize these daily forecasts by the I Know First market prediction system as a tool to enhance portfolio performance, verify their own analysis and act on market opportunities faster. This forecast was sent to current I Know First subscribers.
How to interpret this diagram
Algorithmic Stock Forecast: The table on the left is a stock forecast produced by I Know First’s algorithm. Each day, subscribers receive forecasts for six different time horizons. Note that the top 10 stocks in the 1-month forecast may be different than those in the 1-year forecast. In the included table, only the relevant stocks have been included. The boxes are arranged according to their respective signal and predictability values (see below for detailed definitions). A green box represents a positive forecast, suggesting a long position, while a red represents a negative forecast, suggesting a short position.
Please note-for trading decisions use the most recent forecast. Get today’s forecast and Top stock picks.


