
Stocks Under 50 Dollars Based on Big Data: Returns up to 49.2% in 3 Months
Stocks Under 50 Dollars
This forecast is part of the Stocks Under 50 Dollars Package, as one of I Know First’s forecast services. The full package includes daily stock predictions for a total of 20 Stocks Under 50 Dollars stocks with bullish and bearish signals:
- Top 10 stocks for the long position
- Top 10 stocks for the short position
Package Name: Stocks Under $50
Recommended Positions: Long
Forecast Length: 3 Months (7/9/2019 – 10/9/2019)
I Know First Average: 8.89%
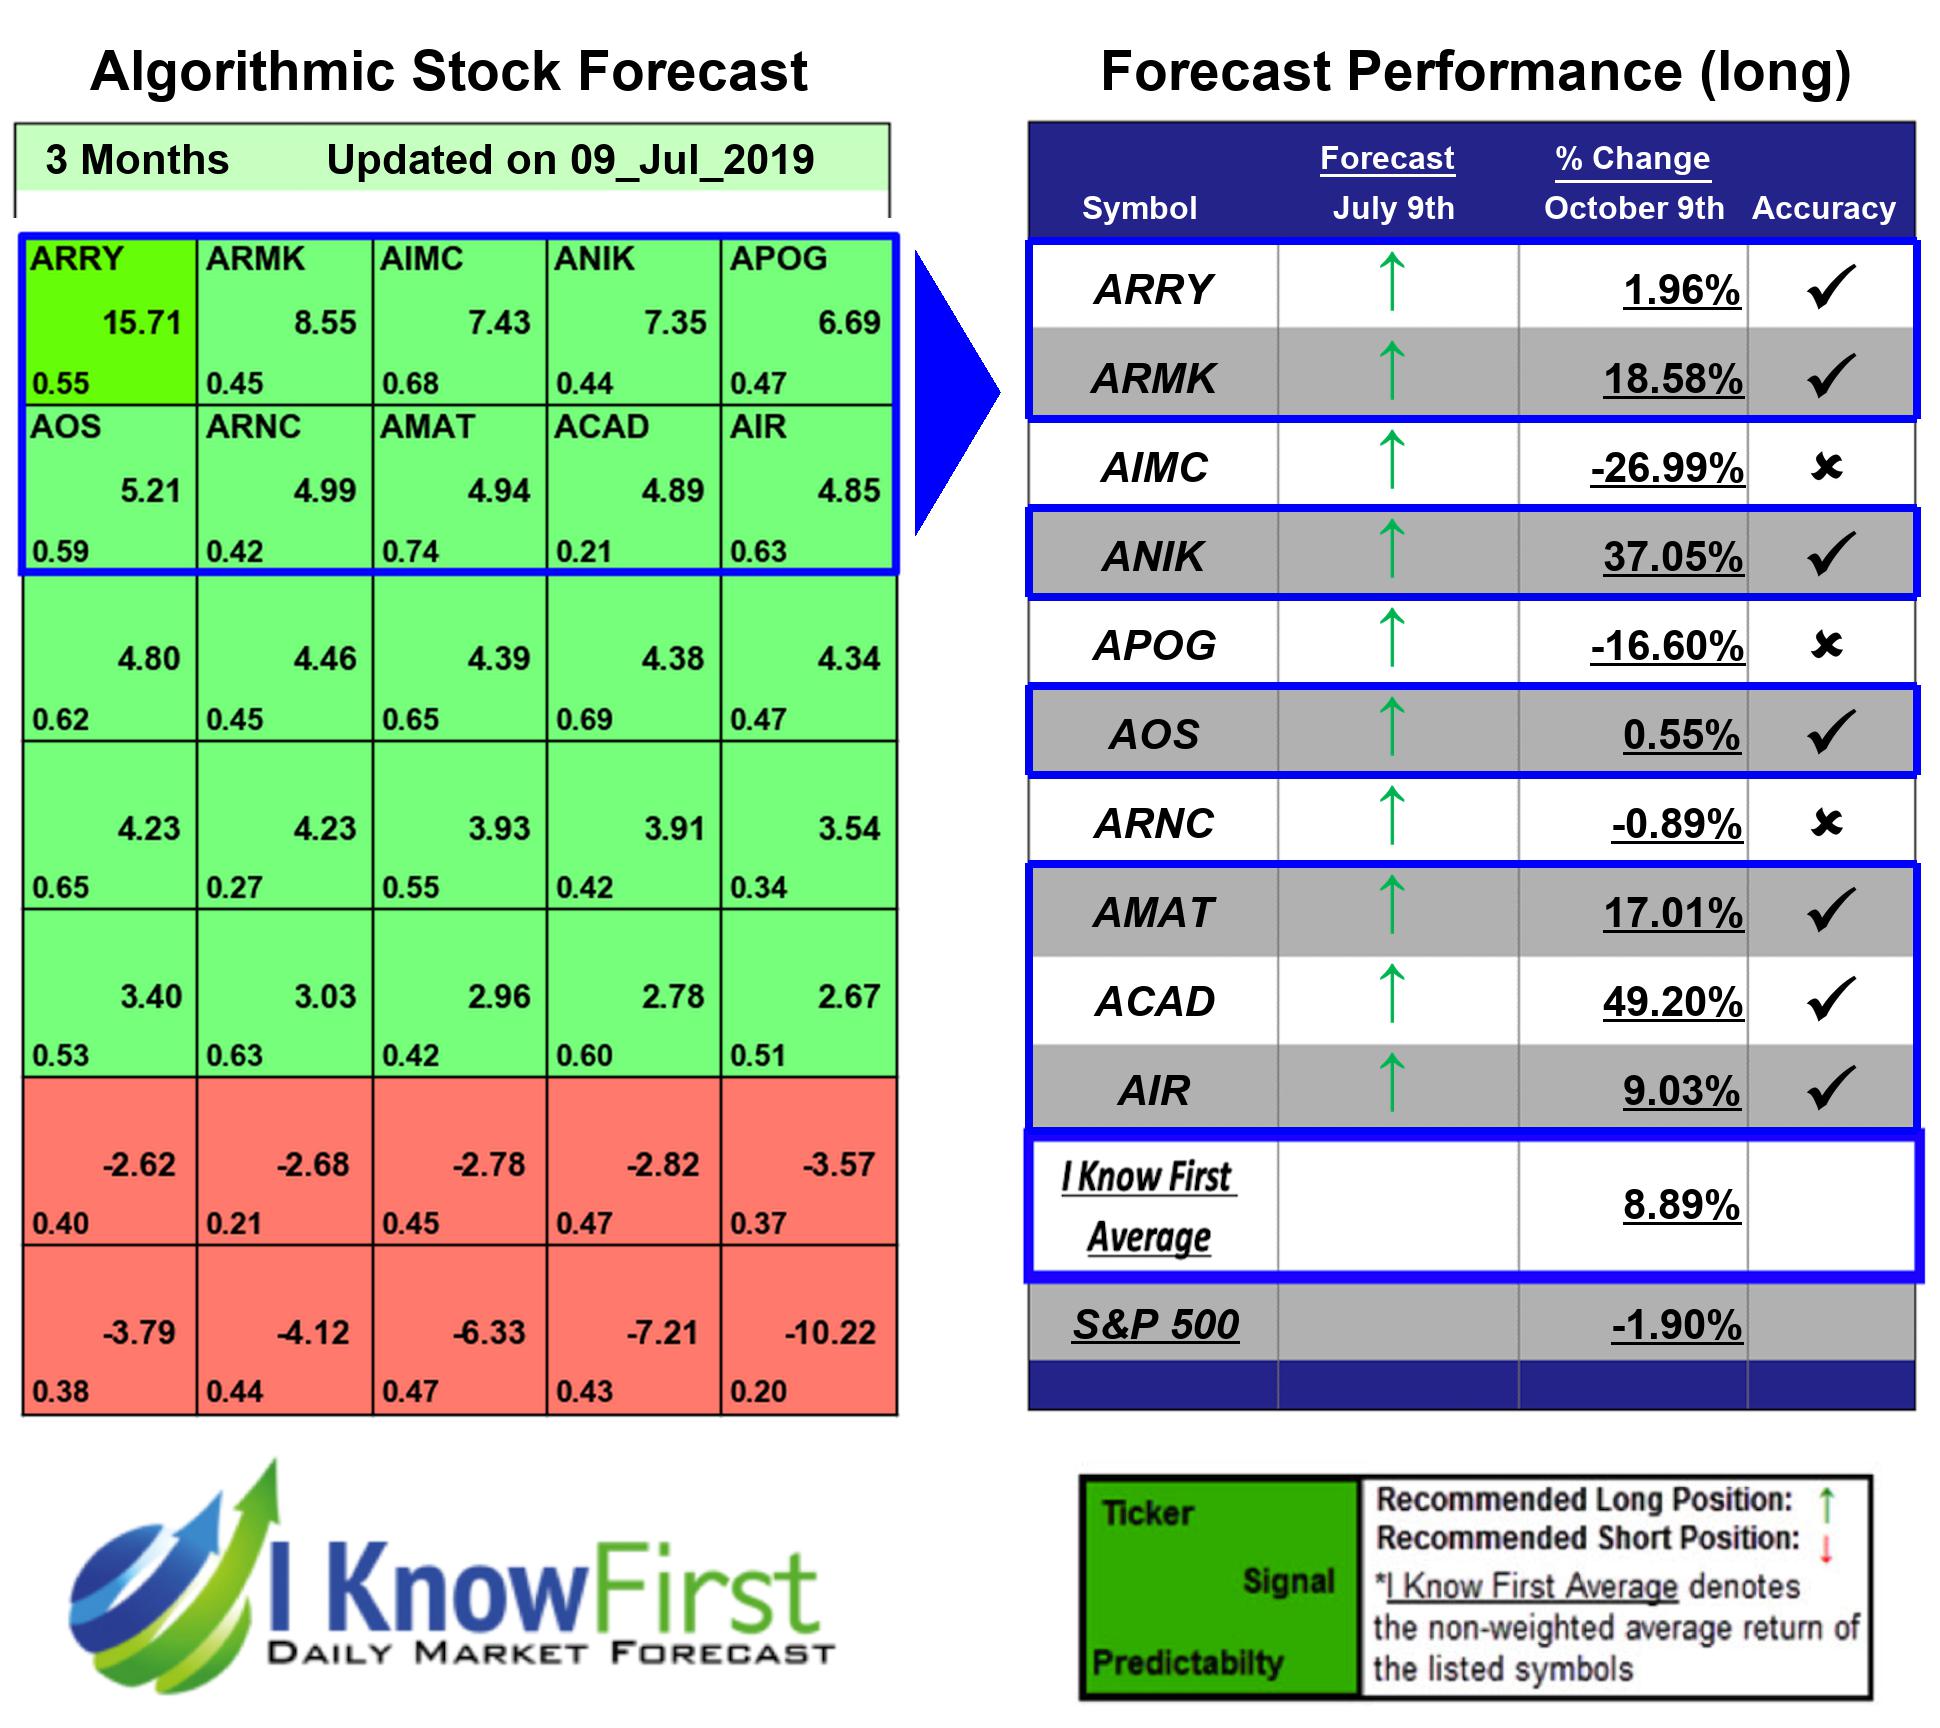
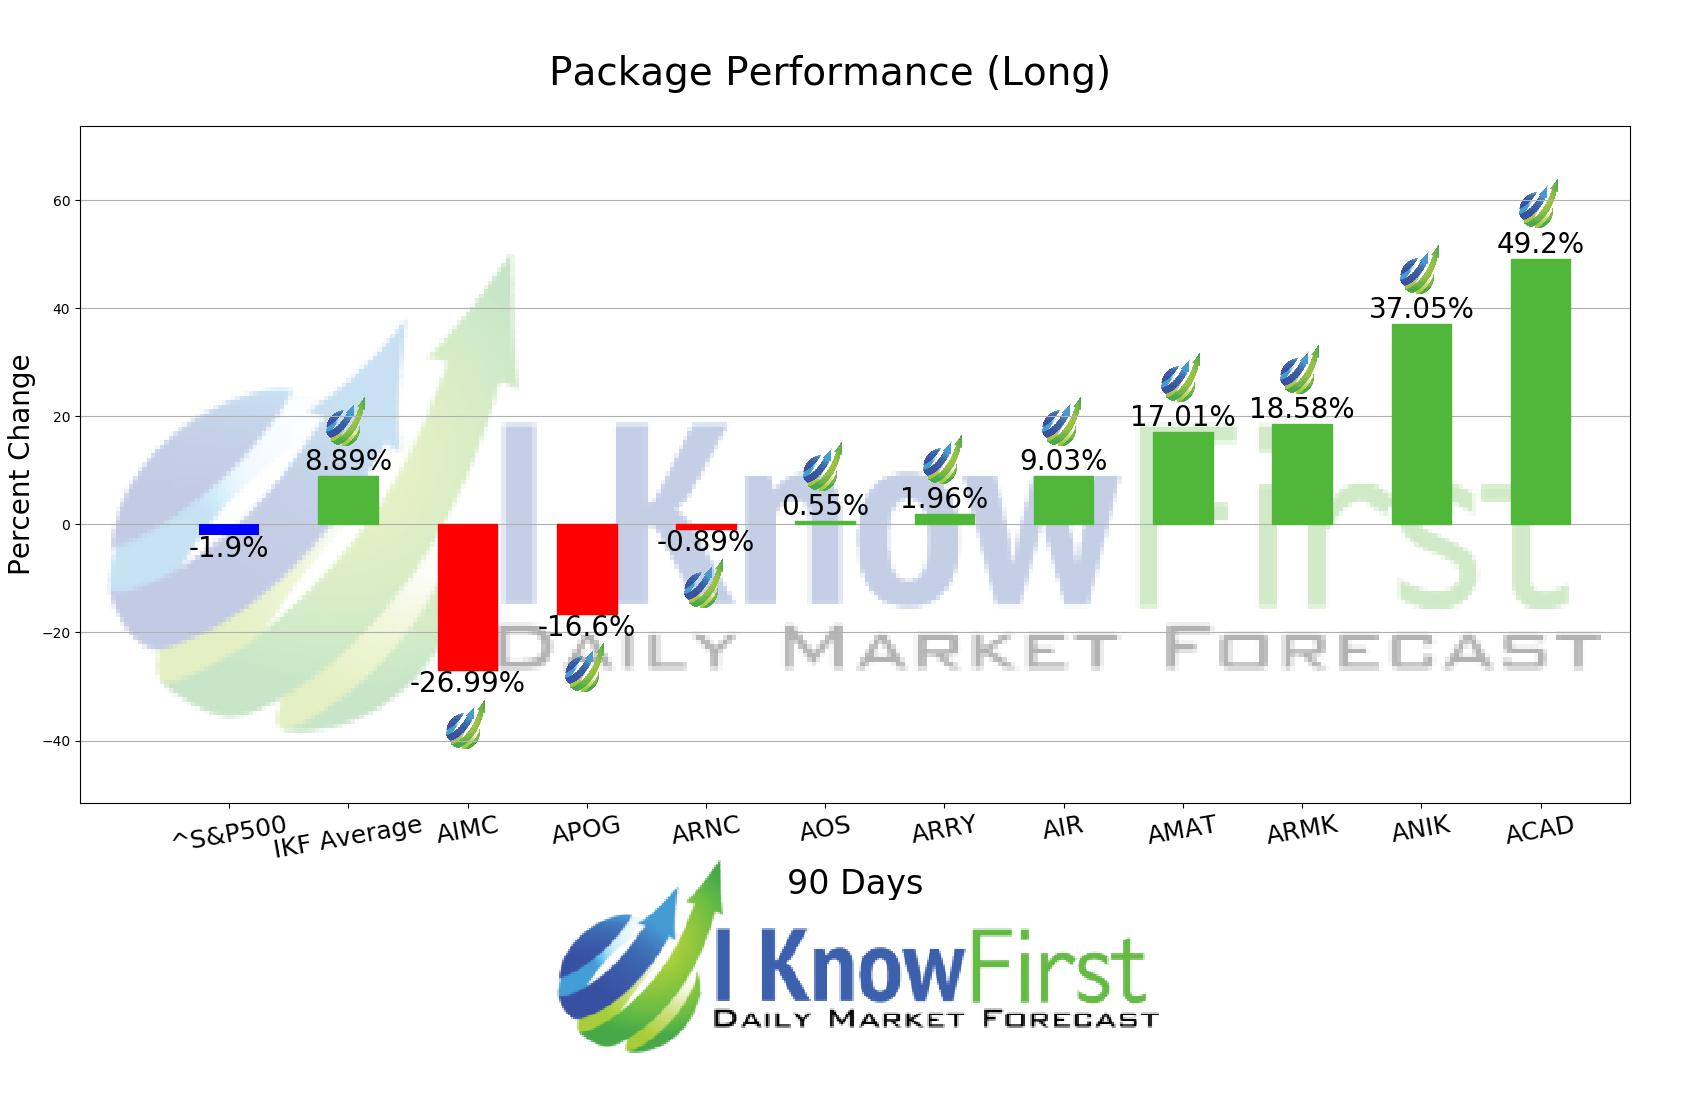
For this 3 Months forecast the algorithm had successfully predicted 7 out of 10 movements. ACAD was the top performing prediction with a return of 49.2%. Other notable stocks were ANIK and ARMK with a return of 37.05% and 18.58%. The package had an overall average return of 8.89%, providing investors with a premium of 10.79% over the S&P 500’s return of -1.9% during the same period.
ACADIA Pharmaceuticals Inc., incorporated on January 16, 1997, is a biopharmaceutical company. The Company is focused on the development and commercialization of medicines for central nervous system (CNS) disorders. The Company’s lead drug candidate, NUPLAZID (pimavanserin), is used for the treatment of hallucinations and delusions associated with Parkinson’s disease psychosis (PD Psychosis). NUPLAZID is a selective serotonin inverse agonist (SSIA), preferentially targeting 5-HT2A receptors.
Algorithmic traders utilize these daily forecasts by the I Know First market prediction system as a tool to enhance portfolio performance, verify their own analysis and act on market opportunities faster. This forecast was sent to current I Know First subscribers.
How to interpret this diagram
Algorithmic Stock Forecast: The table on the left is a stock forecast produced by I Know First’s algorithm. Each day, subscribers receive forecasts for six different time horizons. Note that the top 10 stocks in the 1-month forecast may be different than those in the 1-year forecast. In the included table, only the relevant stocks have been included. The boxes are arranged according to their respective signal and predictability values (see below for detailed definitions). A green box represents a positive forecast, suggesting a long position, while a red represents a negative forecast, suggesting a short position.
Please note-for trading decisions use the most recent forecast. Get today’s forecast and Top stock picks.


