
Stocks Under 10 Based on Big Data Analytics: Returns up to 36.86% in 14 Days
Stocks Under 10
This forecast is part of the Stocks Under 10 Dollars Package, as one of I Know First’s forecast services. The full package includes daily stock predictions for a total of 20 Stocks Under 10 stocks with bullish and bearish signals:
- Top 10 stocks for the long position
- Top 10 stocks for the short position

Package Name: Stocks Under $10
Recommended Positions: Long
Forecast Length: 14 Days (7/9/2020 – 7/23/2020)
I Know First Average: 6.91%
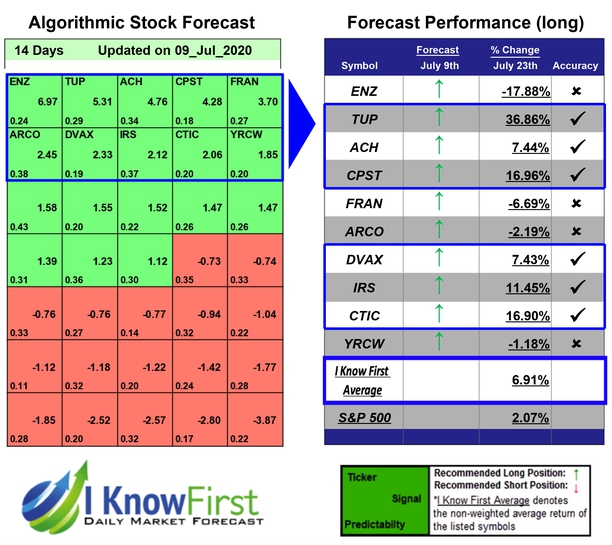

For this 14 Days forecast the algorithm had successfully predicted 6 out of 10 movements. The greatest return came from TUP at 36.86%. Further notable returns came from CPST and CTIC at 16.96% and 16.9%, respectively. The package’s overall average return was 6.91%, providing investors with a 4.84% premium over the S&P 500’s return of 2.07% during the same period.
Tupperware Brands Corporation (TUP) operates as a direct-to-consumer marketer of various products across a range of brands and categories worldwide. The company engages in the manufacture and sale of design-centric preparation, storage, and serving solutions for the kitchen and home, as well as a line of cookware, knives, microwave products, microfiber textiles, water-filtration related items, and an array of products for on-the-go consumers under the Tupperware brand name. It also manufactures and distributes skin and hair care products, cosmetics, bath and body care, toiletries, fragrances, jewelry, and nutritional products under the Avroy Shlain, NaturCare, Nutrimetics, Fuller, BeautiControl, Armand Dupree, Fuller Cosmetics, and Nuvo brands. The company sells its products directly to distributors, directors, managers, and dealers. The company was formerly known as Tupperware Corporation and changed its name to Tupperware Brands Corporation (TUP) in December 2005. Tupperware Brands Corporation (TUP) was founded in 1996 and is headquartered in Orlando, Florida.
Algorithmic traders utilize these daily forecasts by the I Know First market prediction system as a tool to enhance portfolio performance, verify their own analysis and act on market opportunities faster. This forecast was sent to current I Know First subscribers.
How to interpret this diagram
Algorithmic Stock Forecast: The table on the left is a stock forecast produced by I Know First’s algorithm. Each day, subscribers receive forecasts for six different time horizons. Note that the top 10 stocks in the 1-month forecast may be different than those in the 1-year forecast. In the included table, only the relevant stocks have been included. The boxes are arranged according to their respective signal and predictability values (see below for detailed definitions). A green box represents a positive forecast, suggesting a long position, while a red represents a negative forecast, suggesting a short position.
Please note-for trading decisions use the most recent forecast. Get today’s forecast and Top stock picks.


