
Stock Screener Based on Algo Trading: Returns up to 140.1% in 1 Year
Stock Screener
An insider is legally permitted to buy and sell shares of the firm – and any subsidiaries – that employs him or her. However, these transactions must be properly registered with the Securities and Exchange Commission (SEC) and are done with advance filings. You can find details of this type of insider trading on the SEC’s EDGAR database. This Stock Screener algorithmic forecast is for stocks with recently reported insiders’ transactions.

Package Name: Insider Trades
Recommended Positions: Long
Forecast Length: 1 Year (10/16/20 – 10/17/21)
I Know First Average: 63.37%
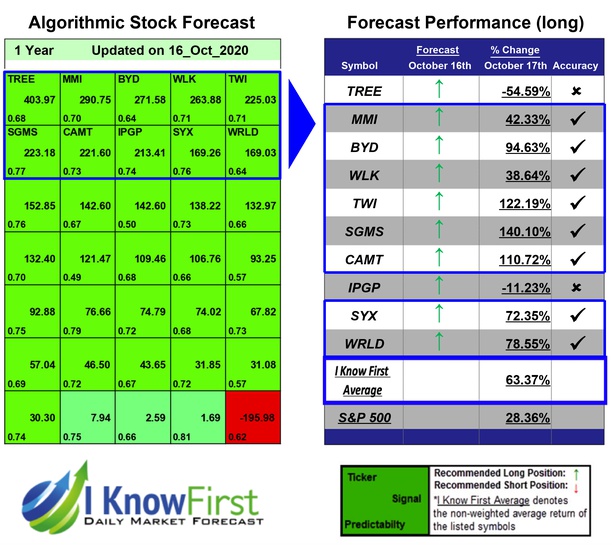
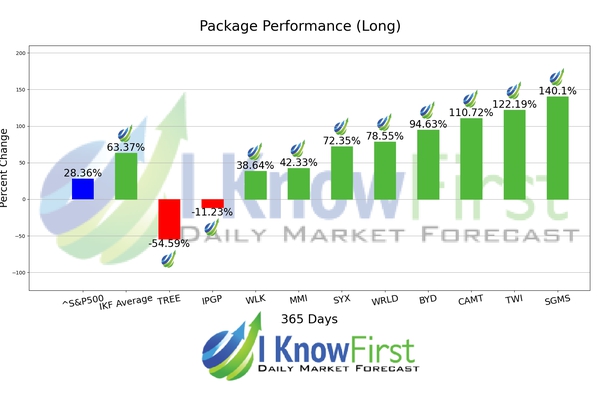
During the 1 Year forecasted period several picks in the Insider Trades Package saw significant returns. The algorithm had correctly predicted 8 out 10 returns. The greatest return came from SGMS at 140.1%. Other notable stocks were TWI and CAMT with a return of 122.19% and 110.72%. The overall average return in this Insider Trades package was 63.37%, providing investors with a 35.01% premium over the S&P 500’s return of 28.36% during the same period.
Scientific Games Corporation develops technology-based products and services, and associated content for the gaming, lottery, and interactive gaming industries worldwide. Its Gaming segment sells new and used gaming machines, electronic table systems, video lottery terminals (VLTs), conversion game kits, and spare parts; and slot, casino, and table-management systems, as well as leases VLTs and electronic table games.
Algorithmic traders utilize these daily forecasts by the I Know First market prediction system as a tool to enhance portfolio performance, verify their own analysis and act on market opportunities faster. This forecast was sent to current I Know First subscribers.
How to interpret this diagram
Algorithmic Stock Forecast: The table on the left is a stock forecast produced by I Know First’s algorithm. Each day, subscribers receive forecasts for six different time horizons. Note that the top 10 stocks in the 1-month forecast may be different than those in the 1-year forecast. In the included table, only the relevant stocks have been included. The boxes are arranged according to their respective signal and predictability values (see below for detailed definitions). A green box represents a positive forecast, suggesting a long position, while a red represents a negative forecast, suggesting a short position.
Please note-for trading decisions use the most recent forecast. Get today’s forecast and Top stock picks.


