
Stock Predictions Based on Machine Learning: Returns up to 47.88% in 1 Month
Stock Predictions
The Fundamental Package includes our algorithmic forecasts and stock predictions for stocks screened by fundamental criteria. Our algorithms help you find best opportunities for both long and short positions for the stocks within each fundamental screen. The stocks are selected according to five basic valuation categories:
- P/E (price to earnings ratio)
- PEG (price/earnings to growth ratio)
- price-to-book ratio
- price-to-sales ratio
- short ratio

Package Name: Fundamental – Low Price-to-Book ratio Stocks
Recommended Positions: Long
Forecast Length: 1 Month (11/15/2020 – 12/15/2020)
I Know First Average: 20.98%
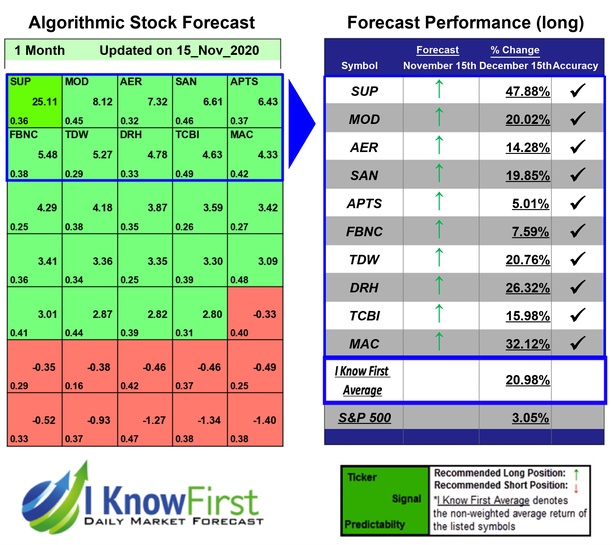

The algorithm correctly predicted 10 out 10 of the suggested trades in the Fundamental – Low Price-to-Book ratio Stocks Package for this 1 Month forecast. The top performing prediction from this package was SUP with a return of 47.88%. Additional high returns came from MAC and DRH, at 32.12% and 26.32% respectively. With these notable trade returns, the package itself registered an average return of 20.98% compared to the S&P 500’s return of 3.05% for the same period.
Superior Industries International, Inc. (SUP) designs, manufactures, and sells aluminum wheels to the original equipment manufacturers in North America. It supplies cast aluminum wheels to the automobile and light truck manufacturers. The company was founded in 1957 and is headquartered in Southfield, Michigan.
Algorithmic traders utilize these daily forecasts by the I Know First market prediction system as a tool to enhance portfolio performance, verify their own analysis and act on market opportunities faster. This forecast was sent to current I Know First subscribers.
How to interpret this diagram
Algorithmic Stock Forecast: The table on the left is a stock forecast produced by I Know First’s algorithm. Each day, subscribers receive forecasts for six different time horizons. Note that the top 10 stocks in the 1-month forecast may be different than those in the 1-year forecast. In the included table, only the relevant stocks have been included. The boxes are arranged according to their respective signal and predictability values (see below for detailed definitions). A green box represents a positive forecast, suggesting a long position, while a red represents a negative forecast, suggesting a short position.
Please note-for trading decisions use the most recent forecast. Get today’s forecast and Top stock picks.


