Stock Market Trends Based on Big Data Analytics: Returns up to 34.62% in 1 Month
Stock Market Trends
This Stock Market Trends forecast is designed for investors and analysts who need predictions for the best stocks to invest in the retail estate sector (see Retail Stocks Package). It includes 20 stocks with bullish and bearish signals:
- Top 10 Retail stocks for the long position
- Top 10 Retail stocks for the short position
Package Name: Retail Stocks
Recommended Positions: Long
Forecast Length: 1 Month (7/28/21 – 8/28/21)
I Know First Average: 7.63%
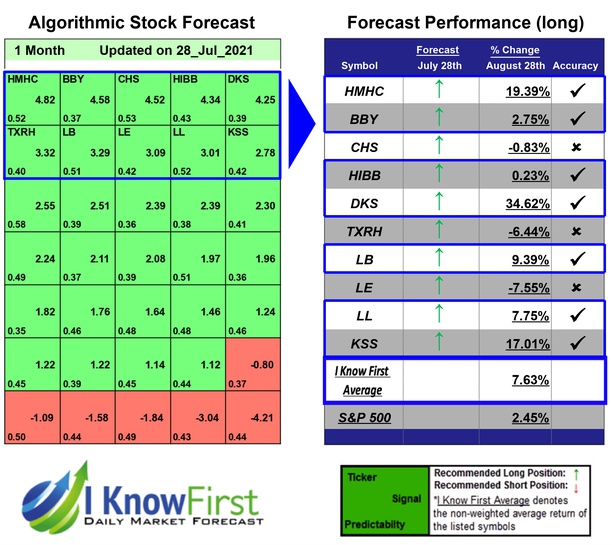
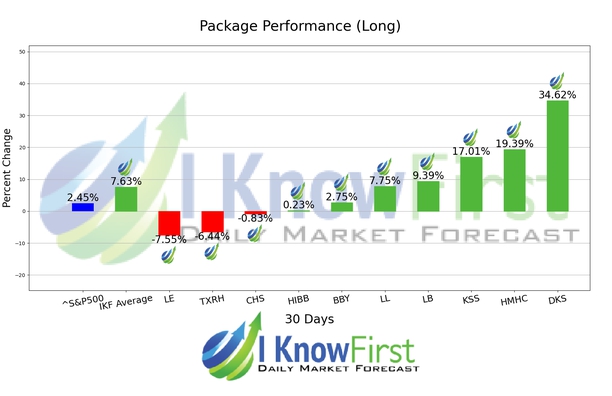
In this 1 Month forecast for the Retail Stocks Package, there were many high performing trades and the algorithm correctly predicted 7 out 10 trades. The top performing prediction from this package was DKS with a return of 34.62%. Additional high returns came from HMHC and KSS, at 19.39% and 17.01% respectively. The package saw an overall yield of 7.63% versus the S&P 500’s return of 2.45% implying a market premium of 5.18%.
Dick’s Sporting Goods, Inc. operates as a sporting goods retailer primarily in the eastern United States. It provides hardlines, including sporting goods equipment, fitness equipment, golf equipment, and hunting and fishing gear products; apparel; and footwear products and accessories. The company also owns and operates Golf Galaxy, Field & Stream, Chelsea Collective, and True Runner specialty concept stores; and e-commerce Websites, such as DICKS.com, golfgalaxy.com, fieldandstreamshop.com, and caliastudio.com. As of October 5, 2016, it operated approximately 665 Dick’s Sporting Goods stores, 73 Golf Galaxy stores, and 19 Field & Stream stores. The company was formerly known as Dick’s Clothing and Sporting Goods, Inc. and changed its name to Dick’s Sporting Goods, Inc. in April 1999. Dick’s Sporting Goods, Inc. was founded in 1948 and is headquartered in Coraopolis, Pennsylvania.
Algorithmic traders utilize these daily forecasts by the I Know First market prediction system as a tool to enhance portfolio performance, verify their own analysis and act on market opportunities faster. This forecast was sent to current I Know First subscribers.
How to interpret this diagram
Algorithmic Stock Forecast: The table on the left is a stock forecast produced by I Know First’s algorithm. Each day, subscribers receive forecasts for six different time horizons. Note that the top 10 stocks in the 1-month forecast may be different than those in the 1-year forecast. In the included table, only the relevant stocks have been included. The boxes are arranged according to their respective signal and predictability values (see below for detailed definitions). A green box represents a positive forecast, suggesting a long position, while a red represents a negative forecast, suggesting a short position.
Please note-for trading decisions use the most recent forecast. Get today’s forecast and Top stock picks.