
Stock Market Outlook Based on Data Mining: Returns up to 184.0% in 1 Year
Stock Market Outlook
An insider is legally permitted to buy and sell shares of the firm – and any subsidiaries – that employs him or her. However, these transactions must be properly registered with the Securities and Exchange Commission (SEC) and are done with advance filings. You can find details of this type of insider trading on the SEC’s EDGAR database. This Stock Market Outlook algorithmic forecast is for stocks with recently reported insiders’ transactions.
An “insider” is any person who possesses at least one of the following:
- access to valuable non-public information about a corporation (for example a company’s directors and high-level executives)
- ownership of more than 10% of the company’s equity

Package Name: Insider Trades
Recommended Positions: Long
Forecast Length: 1 Year (10/20/2019 – 10/21/2020)
I Know First Average: 35.97%
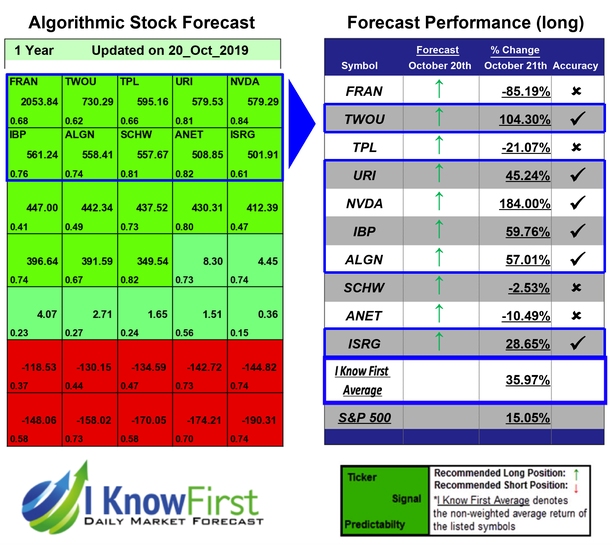

6 out of 10 stock prices in this forecast for the Insider Trades Package moved as predicted by the algorithm. The greatest return came from NVDA at 184.0%. TWOU, and IBP had notable returns of 104.3% and 59.76%. The package saw an overall yield of 35.97% versus the S&P 500’s return of 15.05% implying a market premium of 20.92%.
NVIDIA Corporation (NVDA) is as a visual computing company worldwide. It operates in two segments, GPU and Tegra Processor. The GPU segment offers processors, which include GeForce for PC gaming; Quadro for design professionals working in computer-aided design, video editing, special effects, and other creative applications
Algorithmic traders utilize these daily forecasts by the I Know First market prediction system as a tool to enhance portfolio performance, verify their own analysis and act on market opportunities faster. This forecast was sent to current I Know First subscribers.
How to interpret this diagram
Algorithmic Stock Forecast: The table on the left is a stock forecast produced by I Know First’s algorithm. Each day, subscribers receive forecasts for six different time horizons. Note that the top 10 stocks in the 1-month forecast may be different than those in the 1-year forecast. In the included table, only the relevant stocks have been included. The boxes are arranged according to their respective signal and predictability values (see below for detailed definitions). A green box represents a positive forecast, suggesting a long position, while a red represents a negative forecast, suggesting a short position.
Please note-for trading decisions use the most recent forecast. Get today’s forecast and Top stock picks.


