
Stock Market Outlook Based on Artificial Intelligence: Returns up to 4.64% in 7 Days
Stock Market Outlook
This Utilities Stocks forecast is designed for investors and analysts who need stock market outlook of the best utilities stocks to buy for the whole Industry . It includes 10 stocks with bullish and bearish signals and indicates the best utilities stocks to buy:
- Top 10 Utilities stocks for the long position
- Top 10 Utilities stocks for the short position
Package Name: Utilities Stocks
Recommended Positions: Long
Forecast Length: 7 Days (1/20/2020 – 1/27/2020)
I Know First Average: 2.17%
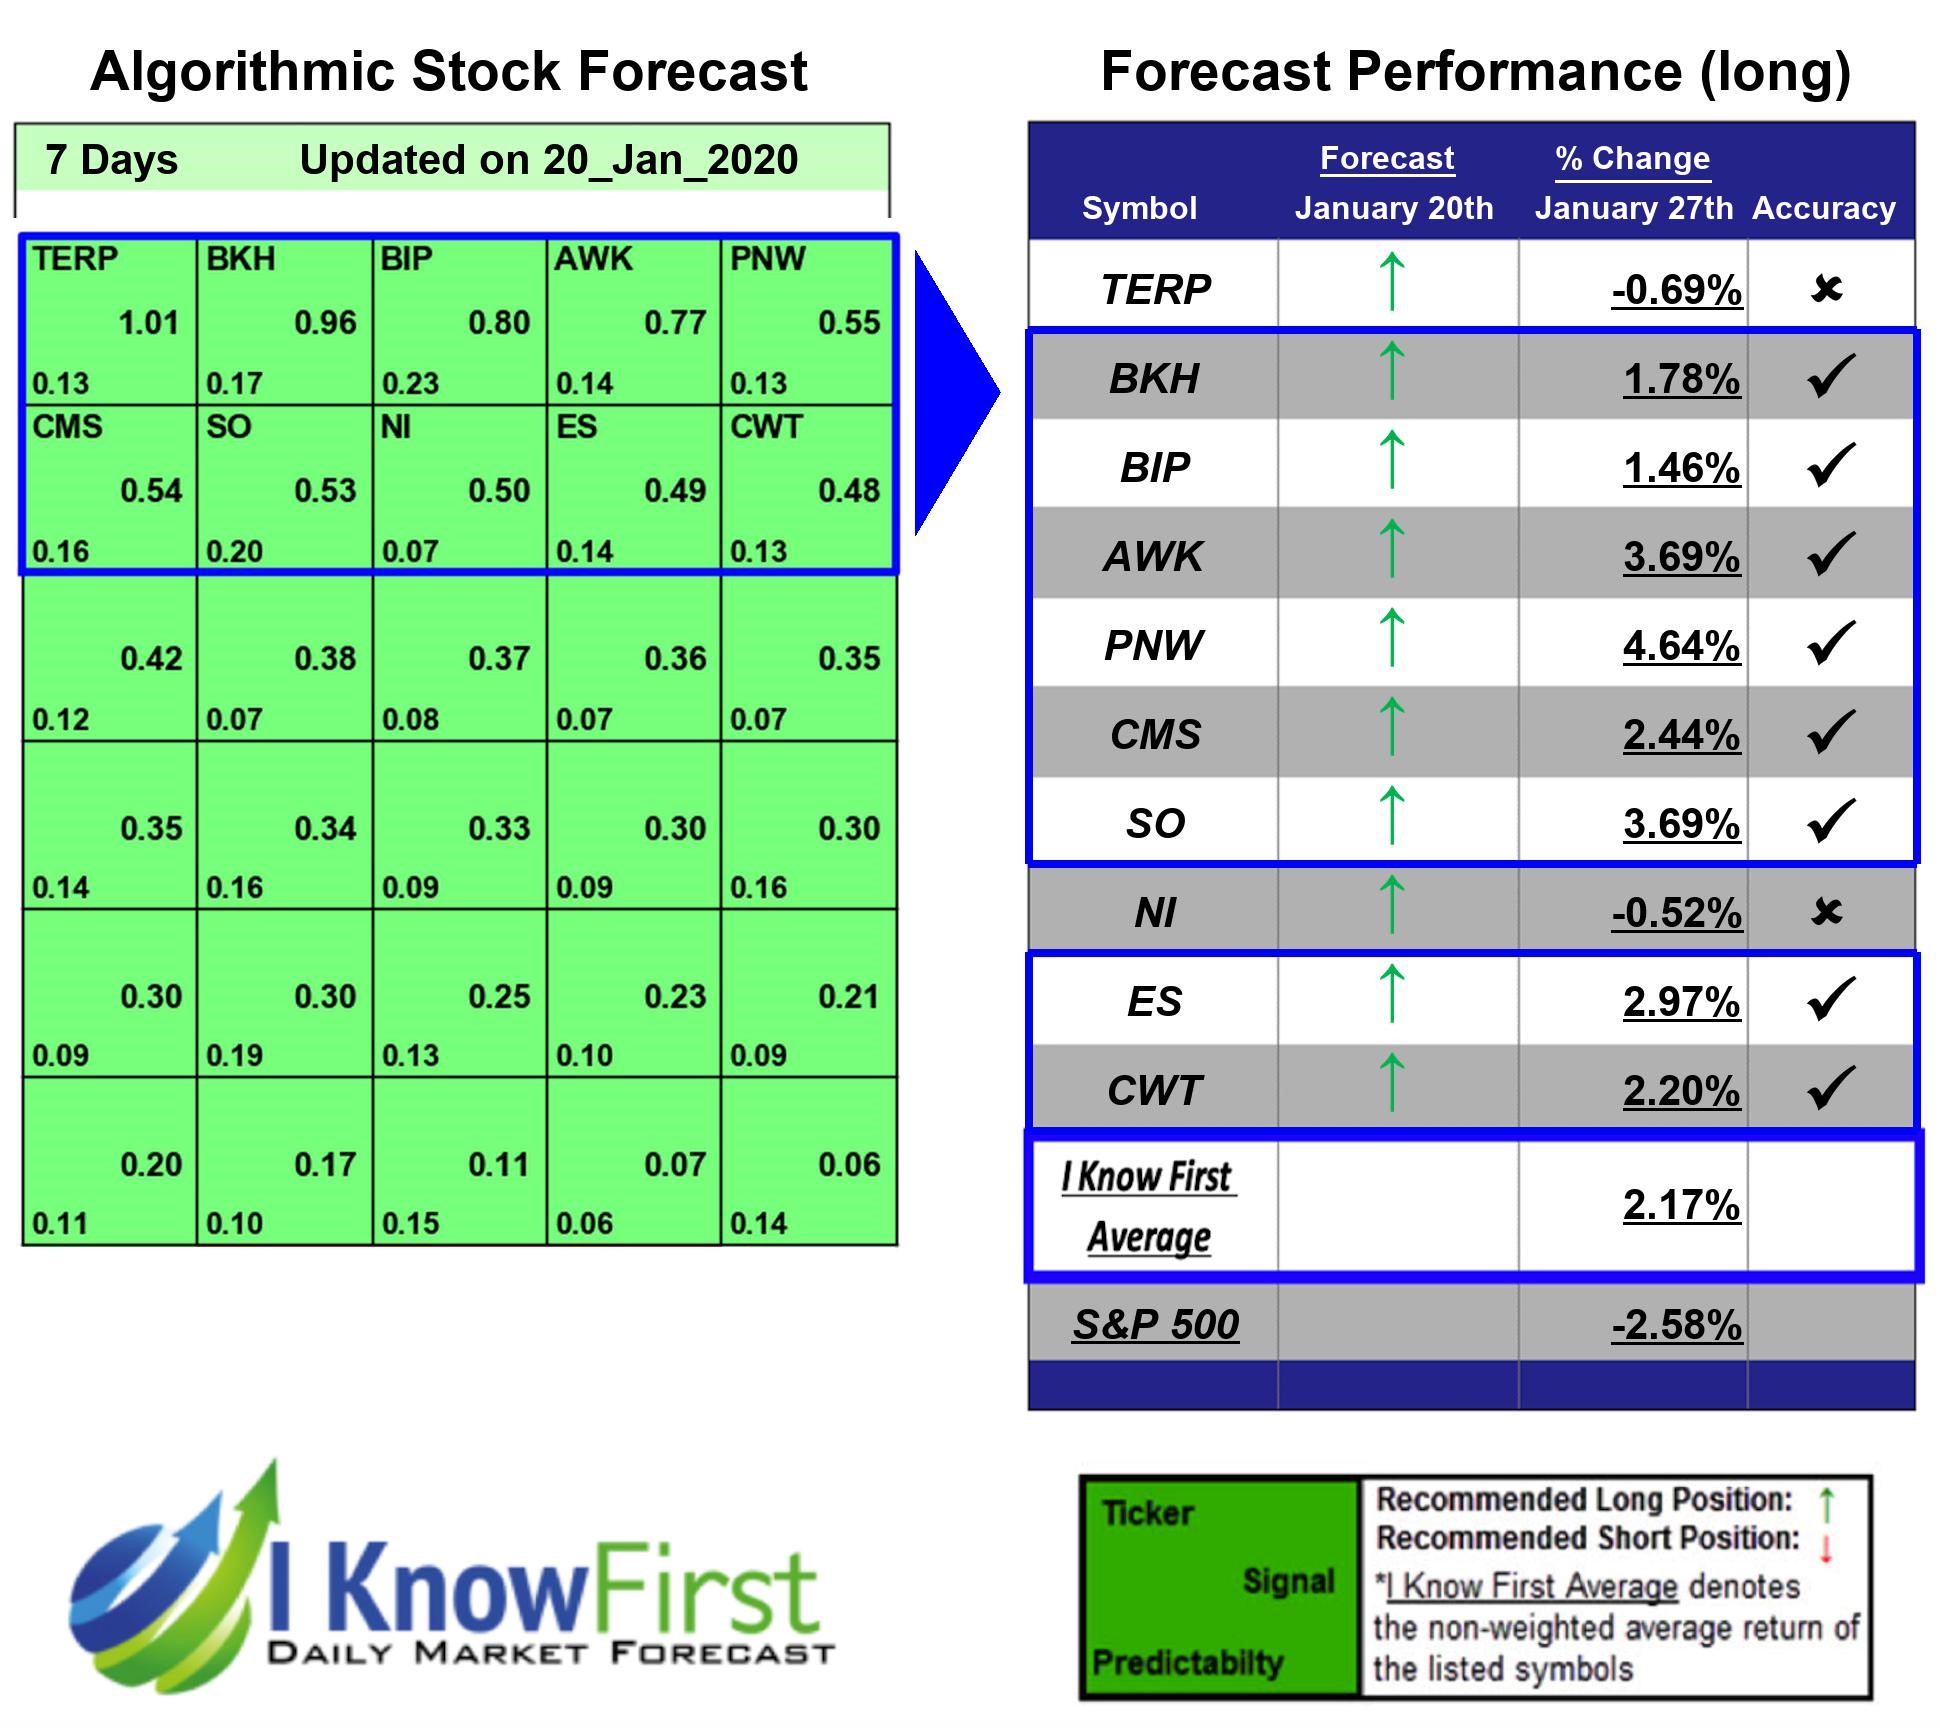
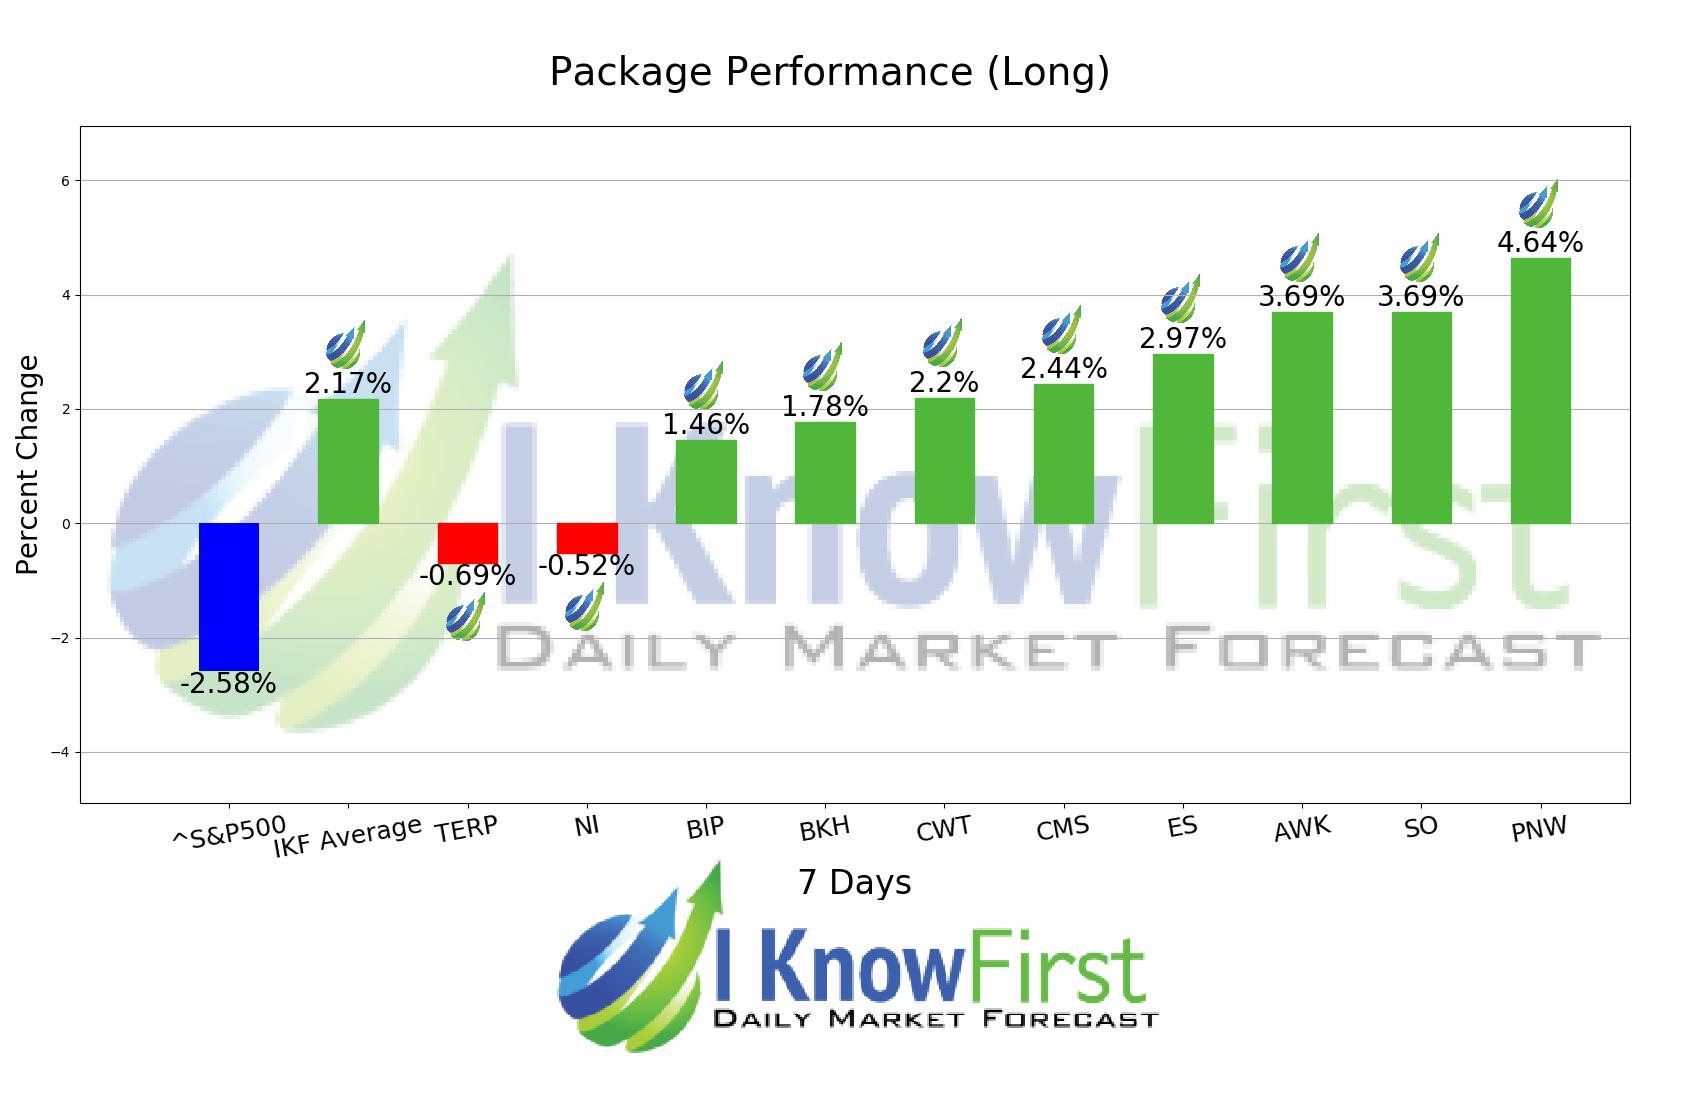
In this 7 Days forecast for the Utilities Stocks Package, there were many high performing trades and the algorithm correctly predicted 8 out 10 trades. The greatest return came from PNW at 4.64%. The suggested trades for AWK and SO also had notable 7 Days yields of 3.69% and 3.69%, respectively. The overall average return in this Utilities Stocks package was 2.17%, providing investors with a 4.75% premium over the S&P 500’s return of -2.58% during the same period.
Pinnacle West Capital Corporation (PNW), through its subsidiary, Arizona Public Service Company, provides retail and wholesale electric services primarily in the State of Arizona. It generates, transmits, and distributes electricity using coal, nuclear, gas, oil, and solar resources. The company serves approximately 1.2 million customers. It owns or leases approximately 6,186 megawatts of regulated generation capacity. The company was founded in 1920 and is headquartered in Phoenix, Arizona.
Algorithmic traders utilize these daily forecasts by the I Know First market prediction system as a tool to enhance portfolio performance, verify their own analysis and act on market opportunities faster. This forecast was sent to current I Know First subscribers.
How to interpret this diagram
Algorithmic Stock Forecast: The table on the left is a stock forecast produced by I Know First’s algorithm. Each day, subscribers receive forecasts for six different time horizons. Note that the top 10 stocks in the 1-month forecast may be different than those in the 1-year forecast. In the included table, only the relevant stocks have been included. The boxes are arranged according to their respective signal and predictability values (see below for detailed definitions). A green box represents a positive forecast, suggesting a long position, while a red represents a negative forecast, suggesting a short position.
Please note-for trading decisions use the most recent forecast. Get today’s forecast and Top stock picks.


