
Stock Market Forecast Based on Deep-Learning: Returns up to 119.63% in 1 Month
Stock Market Forecast
The Fundamental Package includes our algorithmic stock market forecast for stocks screened by fundamental criteria. Our algorithms help you find best opportunities for both long and short positions for the stocks within each fundamental screen. The stocks are selected according to five basic valuation categories:
- P/E (price to earnings ratio)
- PEG (price/earnings to growth ratio)
- price-to-book ratio
- price-to-sales ratio
- short ratio

Package Name: Fundamental – Low Price-to-Book ratio Stocks
Recommended Positions: Long
Forecast Length: 1 Month (5/8/2020 – 6/9/2020)
I Know First Average: 41.52%

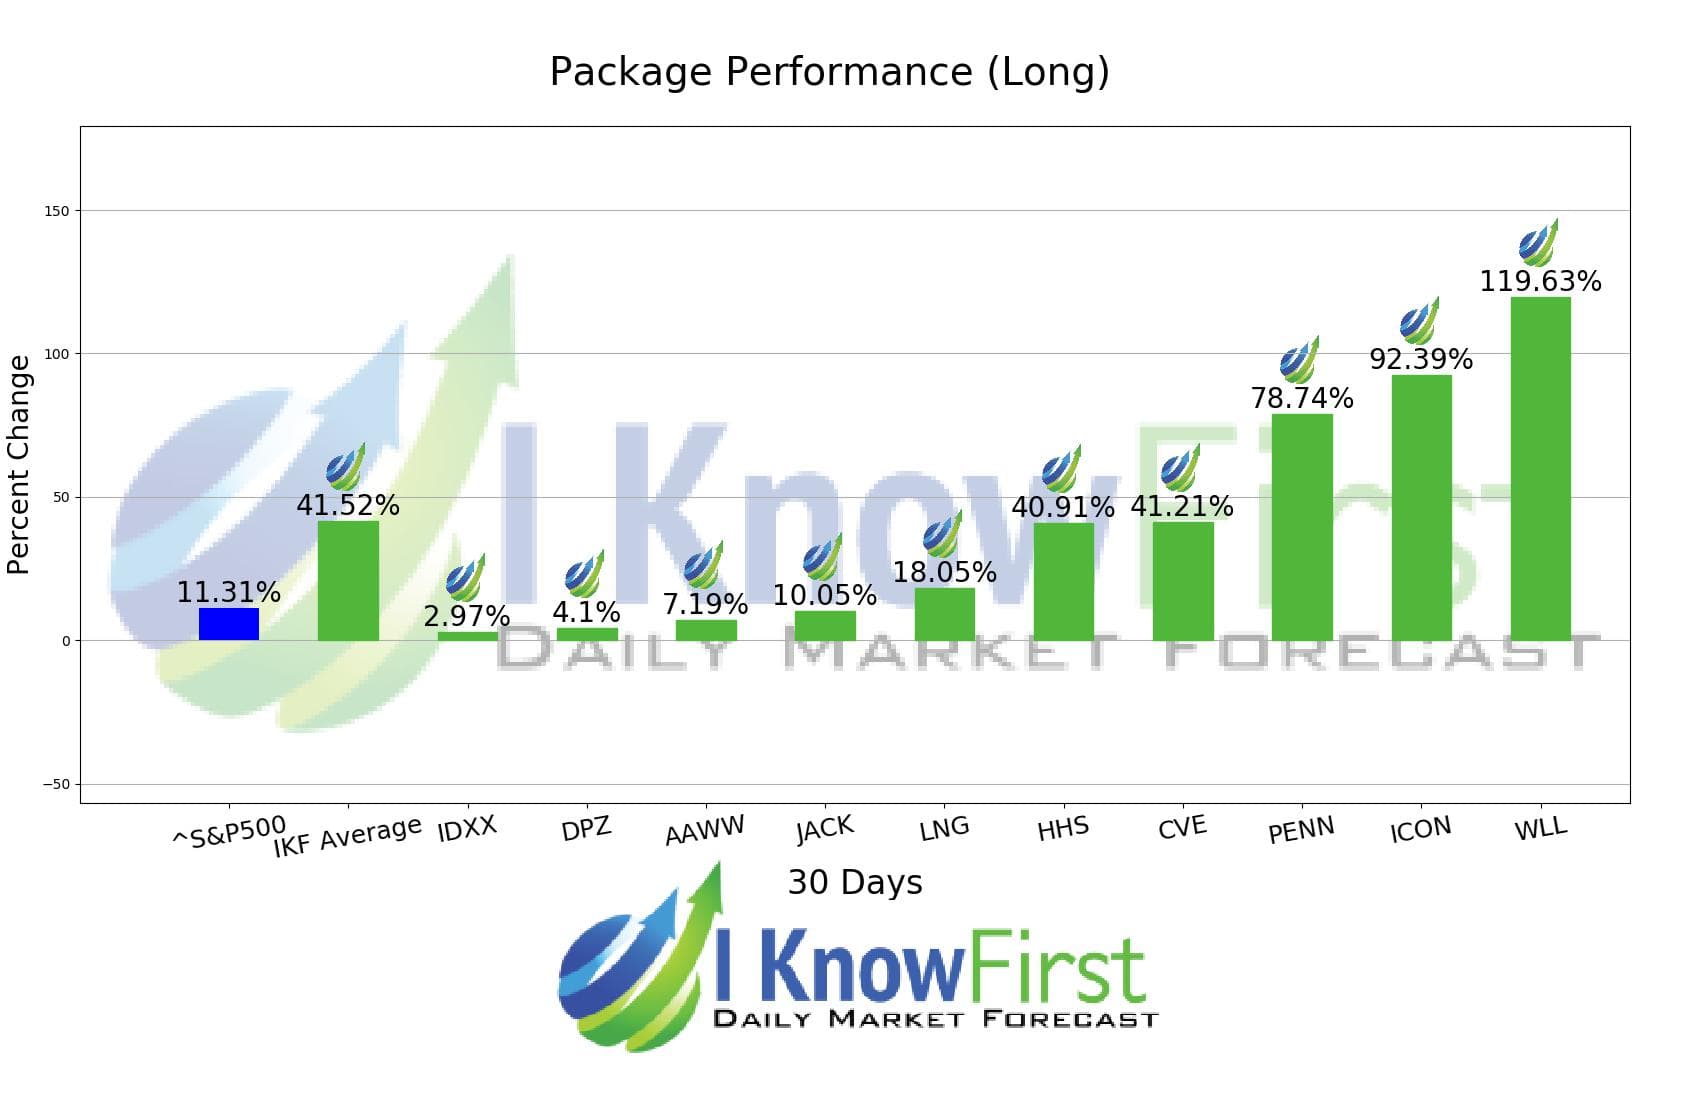
I Know First’s State of the Art Algorithm accurately forecasted 10 out of 10 trades in this Fundamental – Low Price-to-Book ratio Stocks Package for the 1 Month time period. The top performing prediction from this package was WLL with a return of 119.63%. Further notable returns came from ICON and PENN at 92.39% and 78.74%, respectively. The package saw an overall yield of 41.52% versus the S&P 500’s return of 11.31% implying a market premium of 30.21%.
Whiting Petroleum Corp. (WLL) is an oil and gas company focusing in the development, exploration, acquisition, and production of crude oil and natural gas. With its headquarters in Denver, Colorado, the company’s operations spans in the Rocky Mountains and the Great Basin region.
Algorithmic traders utilize these daily forecasts by the I Know First market prediction system as a tool to enhance portfolio performance, verify their own analysis and act on market opportunities faster. This forecast was sent to current I Know First subscribers.
How to interpret this diagram
Algorithmic Stock Forecast: The table on the left is a stock forecast produced by I Know First’s algorithm. Each day, subscribers receive forecasts for six different time horizons. Note that the top 10 stocks in the 1-month forecast may be different than those in the 1-year forecast. In the included table, only the relevant stocks have been included. The boxes are arranged according to their respective signal and predictability values (see below for detailed definitions). A green box represents a positive forecast, suggesting a long position, while a red represents a negative forecast, suggesting a short position.
Please note-for trading decisions use the most recent forecast. Get today’s forecast and Top stock picks.


