
Stock Ideas Based on Big Data: Returns up to 176.85% in 14 Days
Stock Ideas
The Fundamental Package includes our algorithmic forecasts for stocks screened by fundamental criteria. Our algorithms help you find best opportunities for both long and short positions for the stocks within each fundamental screen. The stock ideas are selected according to five basic valuation categories:
- P/E (price to earnings ratio)
- PEG (price/earnings to growth ratio)
- price-to-book ratio
- price-to-sales ratio
- short ratio

Package Name: Fundamental – High Price-to-Sales ratio Stocks
Recommended Positions: Long
Forecast Length: 14 Days (4/19/2020 – 5/3/2020)
I Know First Average: 30.56%
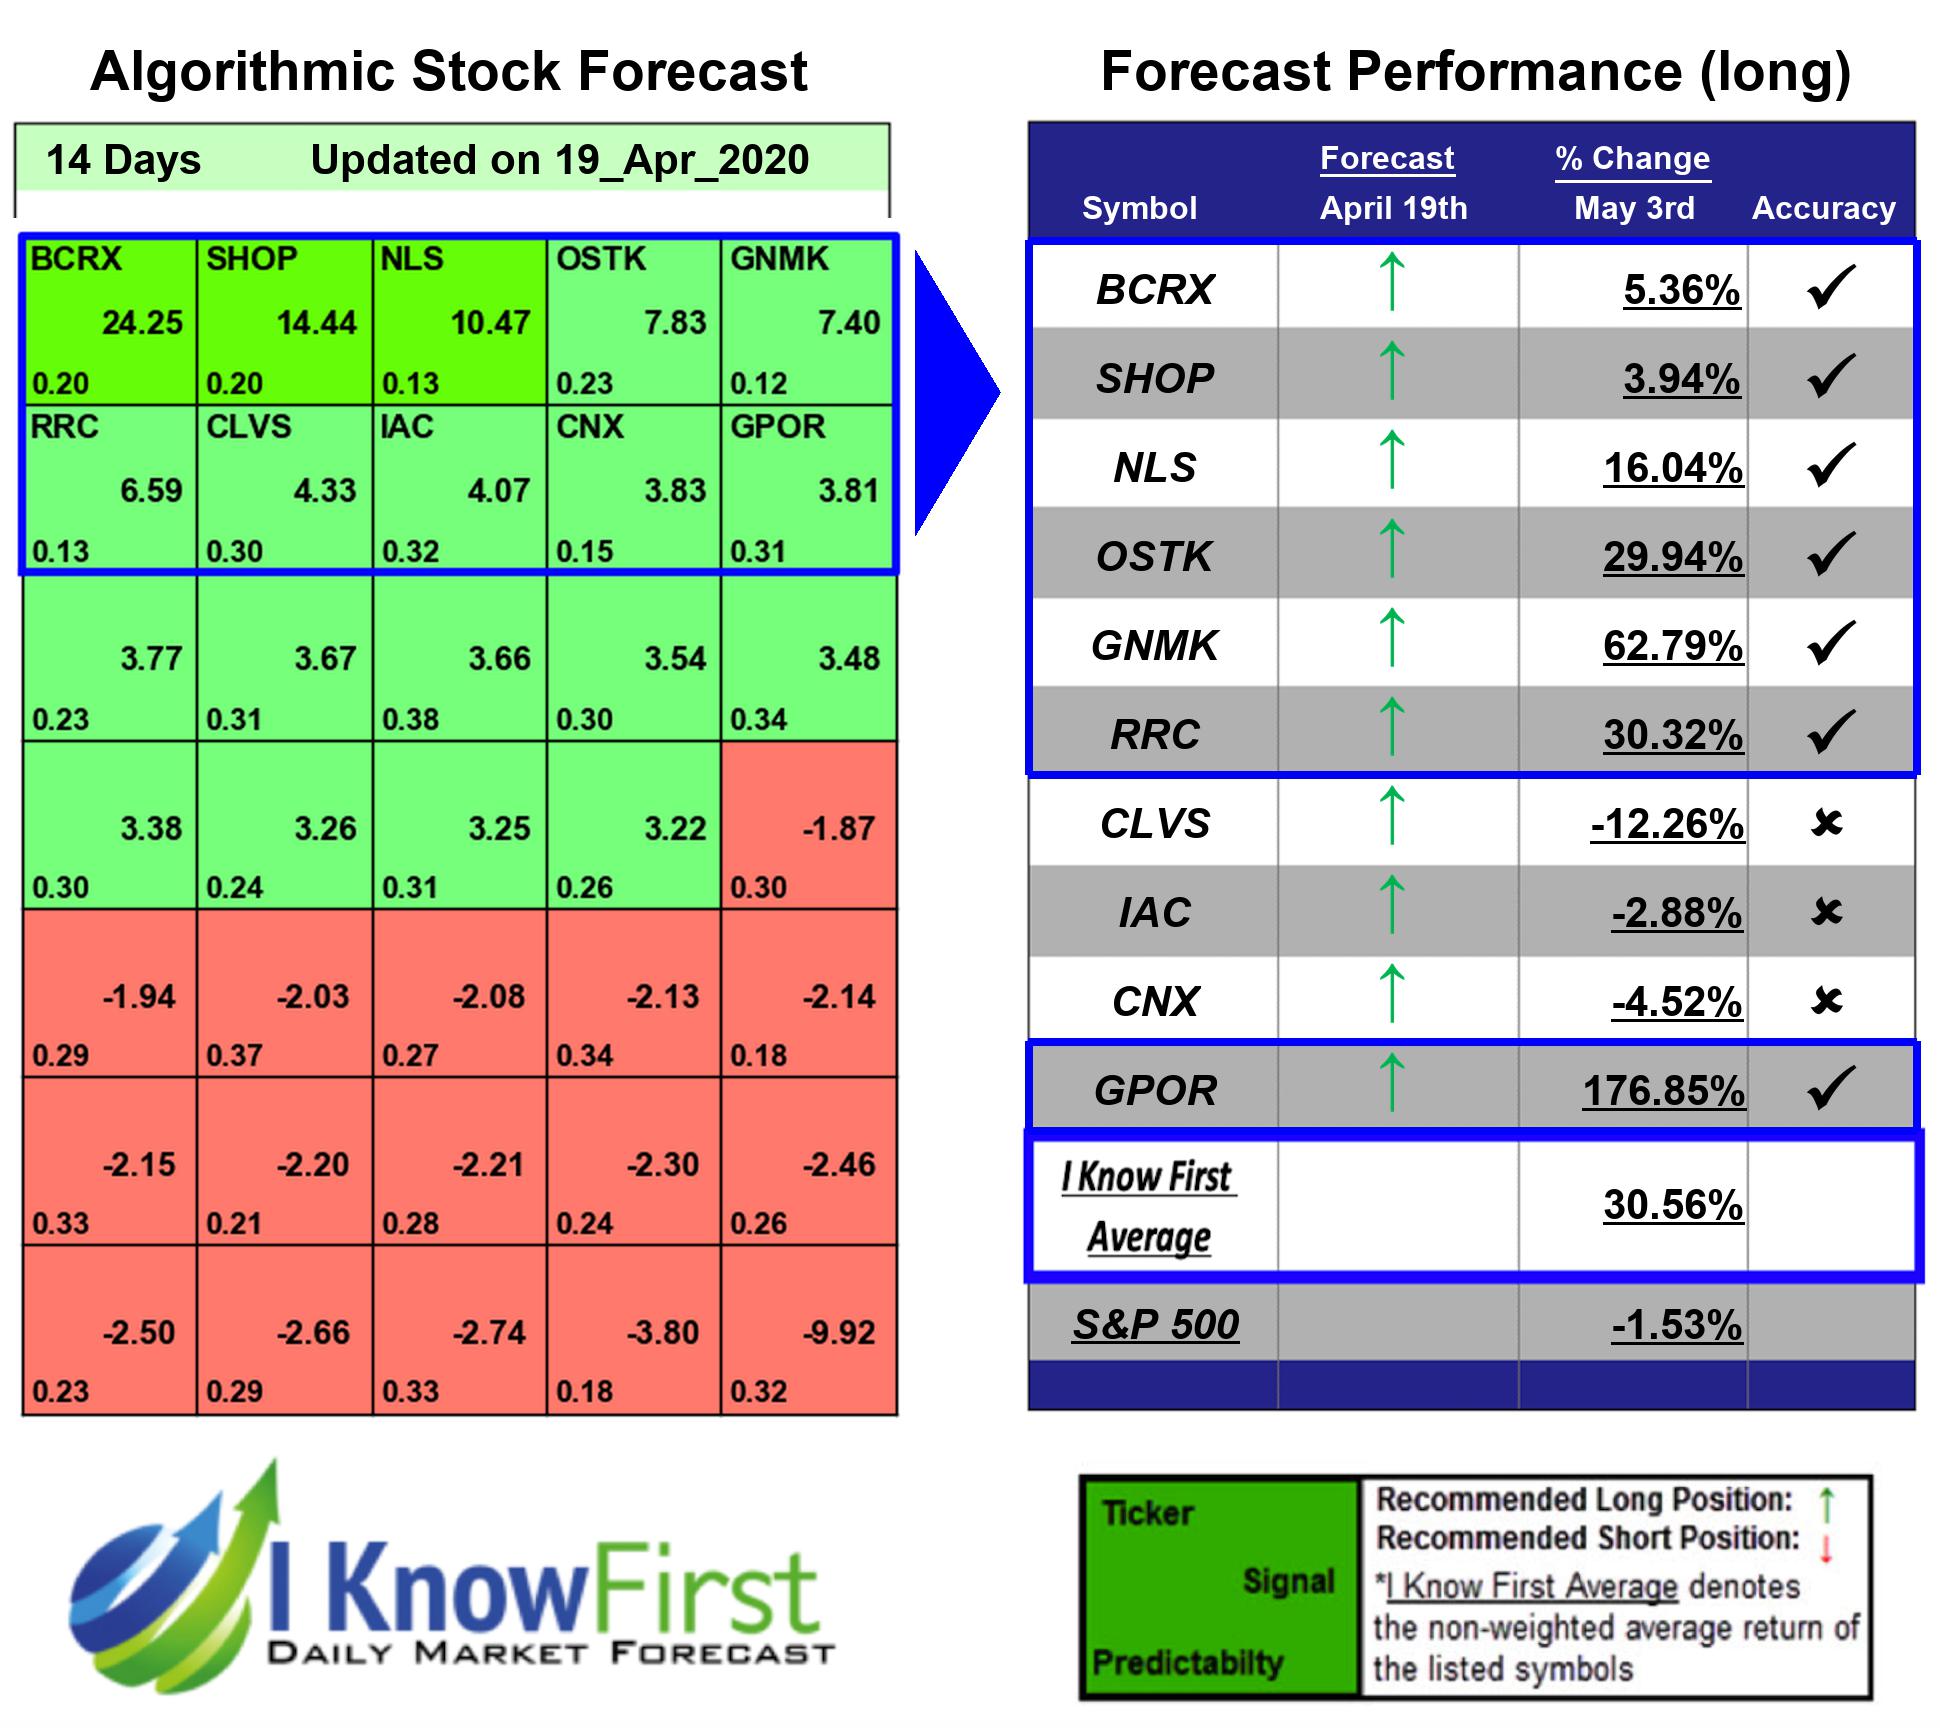
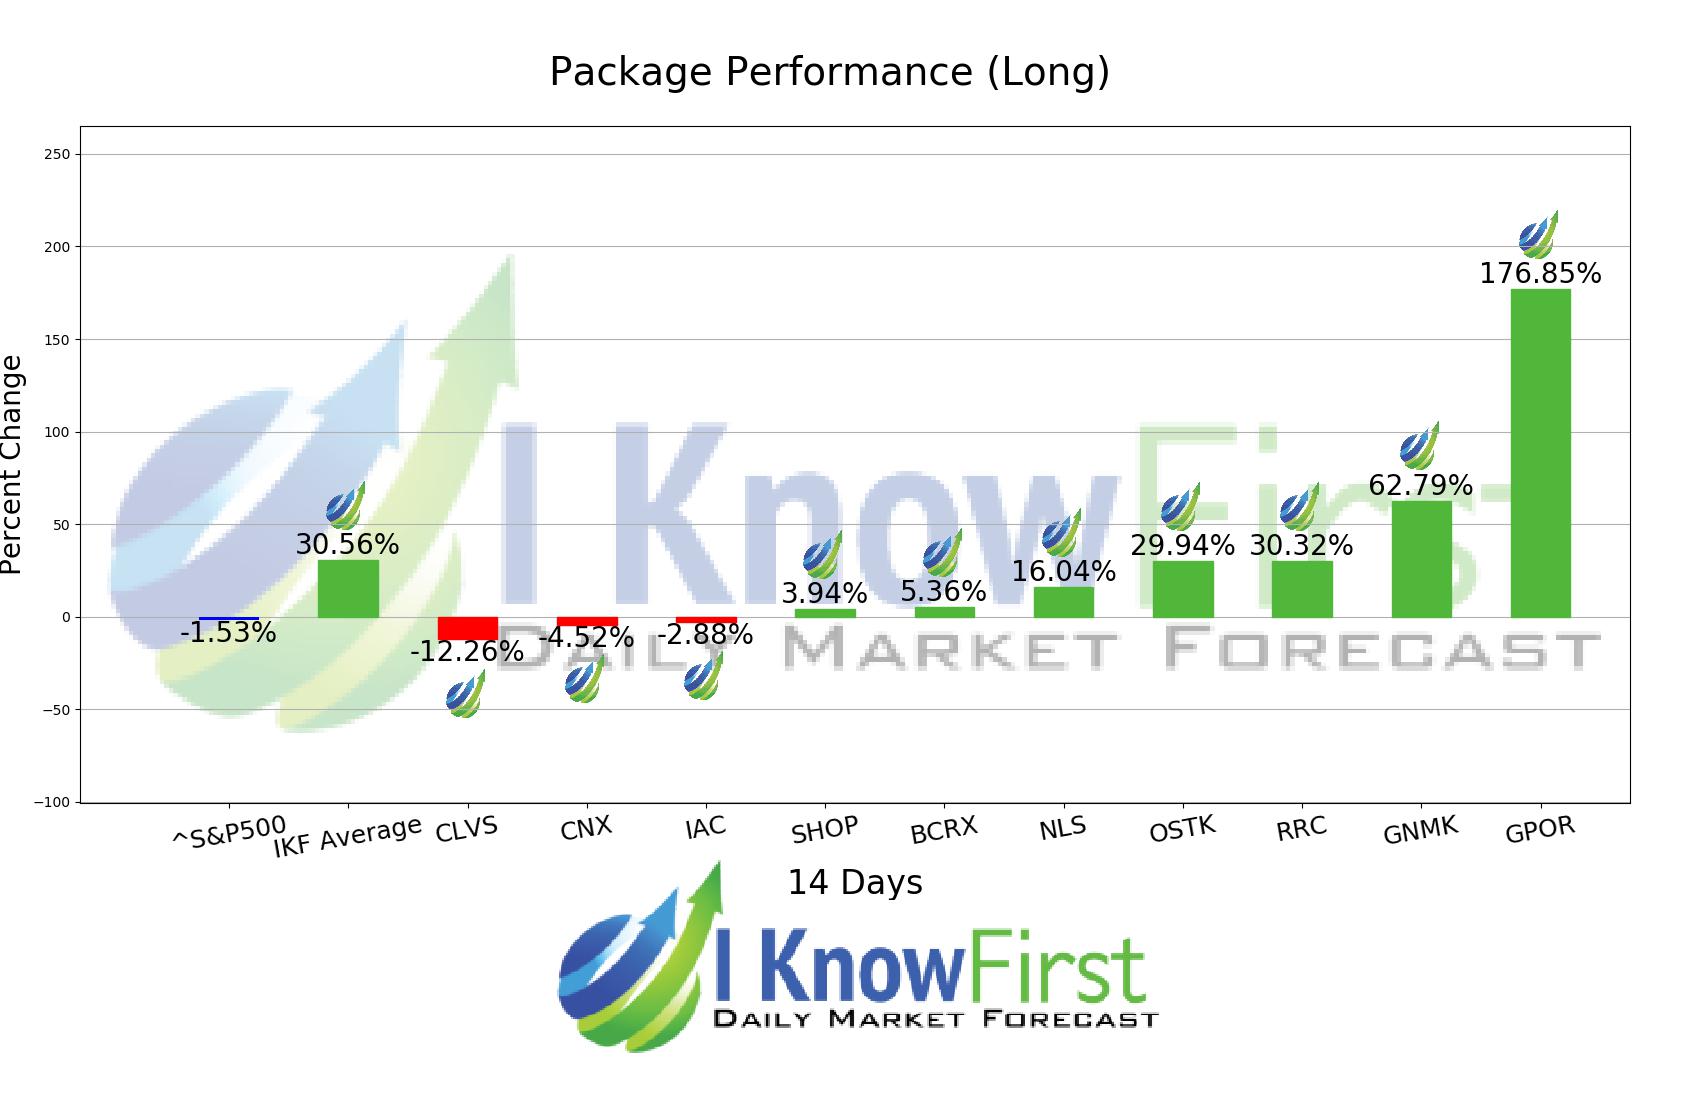
The algorithm correctly predicted 7 out 10 of the suggested trades in the Fundamental – High Price-to-Sales ratio Stocks Package for this 14 Days forecast. The highest trade return came from GPOR, at 176.85%. GNMK and RRC followed with returns of 62.79% and 30.32% for the 14 Days period. The package saw an overall yield of 30.56% versus the S&P 500’s return of -1.53% implying a market premium of 32.09%.
Gulfport Energy Corporation, incorporated on June 20, 1997, is an oil and natural gas exploration and production company. The Company focuses on the exploitation and acquisition of natural gas, natural gas liquids and crude oil in the United States. The Company’s properties are located in the Utica Shale in Eastern Ohio and along the Louisiana Gulf Coast in the West Cote Blanche Bay (WCBB) and Hackberry fields. The Company also has an interest in producing properties in Northwestern Colorado in the Niobrara Formation and in Western North Dakota in the Bakken Formation. The Company also holds an acreage position in the Alberta oil sands in Canada through its interest in Grizzly Oil Sands ULC and an interest in an entity that operates in the Phu Horm gas field in Thailand. The Company also owns interests in various fields, which includes Deer Island, Fay South, Crest, Squaw Cheek, Green River Basin and Watonga Chickasha Trend.
Algorithmic traders utilize these daily forecasts by the I Know First market prediction system as a tool to enhance portfolio performance, verify their own analysis and act on market opportunities faster. This forecast was sent to current I Know First subscribers.
How to interpret this diagram
Algorithmic Stock Forecast: The table on the left is a stock forecast produced by I Know First’s algorithm. Each day, subscribers receive forecasts for six different time horizons. Note that the top 10 stocks in the 1-month forecast may be different than those in the 1-year forecast. In the included table, only the relevant stocks have been included. The boxes are arranged according to their respective signal and predictability values (see below for detailed definitions). A green box represents a positive forecast, suggesting a long position, while a red represents a negative forecast, suggesting a short position.
Please note-for trading decisions use the most recent forecast. Get today’s forecast and Top stock picks.


