
Stock Ideas Based on AI: Returns up to 69.55% in 14 Days
Stock Ideas
The Fundamental Package includes our algorithmic forecasts for stocks screened by fundamental criteria. Our algorithms help you find best opportunities for both long and short positions for the stocks within each fundamental screen. The stock ideas are selected according to five basic valuation categories:
- P/E (price to earnings ratio)
- PEG (price/earnings to growth ratio)
- price-to-book ratio
- price-to-sales ratio
- short ratio

Package Name: Fundamental – Low P/E Stocks
Recommended Positions: Long
Forecast Length: 14 Days (7/19/2020 – 8/3/2020)
I Know First Average: 10.85%
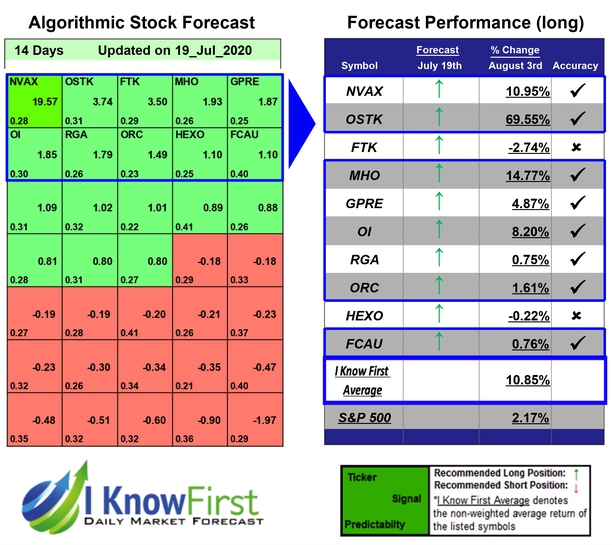
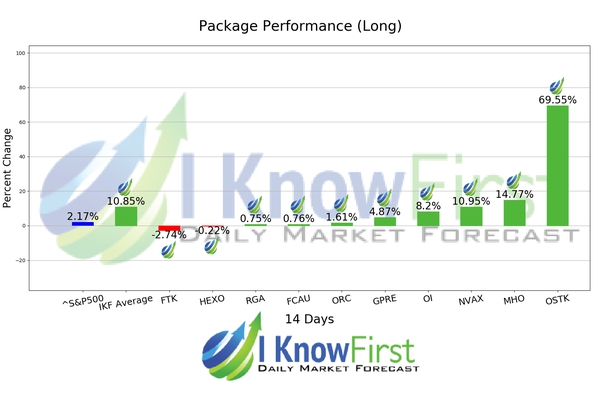
For this 14 Days forecast the algorithm had successfully predicted 8 out of 10 movements. The top-performing prediction in this forecast was OSTK, which registered a return of 69.55%. MHO and NVAX followed with returns of 14.77% and 10.95% for the 14 Days period. This algorithmic forecast package presented an overall return of 10.85% versus S&P 500’s performance of 2.17% providing a market premium of 8.68%.
Overstock.com, Inc. operates as an online retailer in the United States. The company operates through two segments, Direct and Partner. It offers brand name, non-brand name, and closeout products, including furniture, home decor, bedding and bath, housewares, jewelry and watches, apparel and designer accessories, health and beauty products, electronics and computers, and sporting goods, among other products; and sells various books, magazines, CDs, DVDs, and video games.
Algorithmic traders utilize these daily forecasts by the I Know First market prediction system as a tool to enhance portfolio performance, verify their own analysis and act on market opportunities faster. This forecast was sent to current I Know First subscribers.
How to interpret this diagram
Algorithmic Stock Forecast: The table on the left is a stock forecast produced by I Know First’s algorithm. Each day, subscribers receive forecasts for six different time horizons. Note that the top 10 stocks in the 1-month forecast may be different than those in the 1-year forecast. In the included table, only the relevant stocks have been included. The boxes are arranged according to their respective signal and predictability values (see below for detailed definitions). A green box represents a positive forecast, suggesting a long position, while a red represents a negative forecast, suggesting a short position.
Please note-for trading decisions use the most recent forecast. Get today’s forecast and Top stock picks.


