
Stock Forecasting Software Based on Algo Trading: Returns up to 67.06% in 3 Months
Stock Forecasting Software
This Transportation Stocks forecast is designed for investors and analysts who need stock forecasting software providing predictions for the best stocks to invest in the transport sectors (see Transportation Stocks Package). It includes 20 stocks with bullish and bearish signals:
- Top 10 Transportation stocks for the long position
- Top 10 Transportation stocks for the short position

Package Name: Transportation Stocks
Recommended Positions: Long
Forecast Length: 3 Months (1/29/2021 – 4/30/2021)
I Know First Average: 27.66%
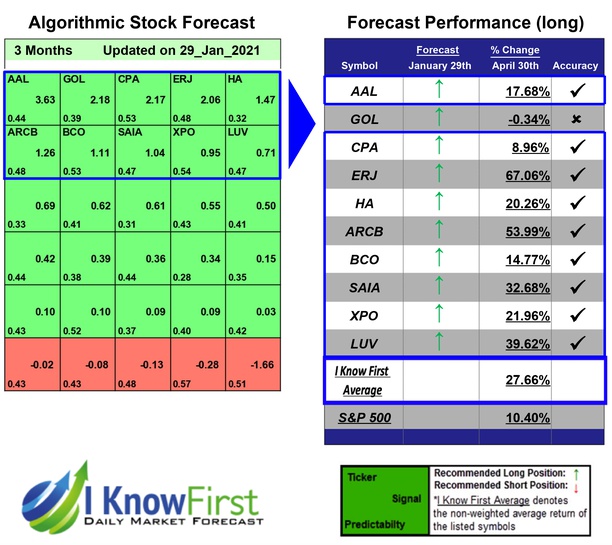
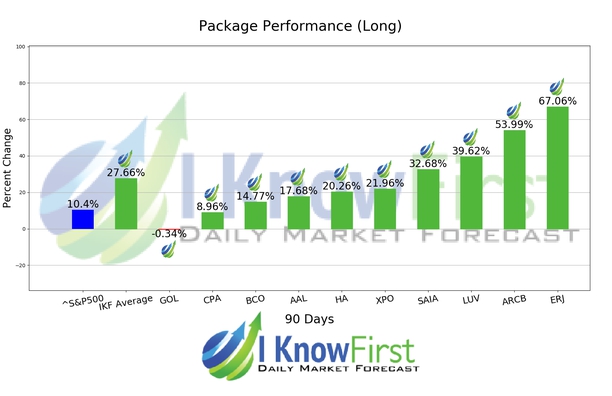
In this 3 Months forecast for the Transportation Stocks Package, there were many high performing trades and the algorithm correctly predicted 9 out 10 trades. ERJ was the top performing prediction with a return of 67.06%. ARCB and LUV also performed well for this time horizon with returns of 53.99% and 39.62%, respectively. The Transportation Stocks package had an overall average return of 27.66%, providing investors with a premium of 17.26% over the S&P 500’s return of 10.4%.
Embraer S.A. (ERJ) Embraer S.A. designs, develops, manufactures, and sells aircraft and systems in Brazil, North America, Latin America, the Asia Pacific, Europe, and internationally. It operates through Commercial Aviation, Executive Jets, Defense & Security, and Other Related Businesses segments.
Algorithmic traders utilize these daily forecasts by the I Know First market prediction system as a tool to enhance portfolio performance, verify their own analysis and act on market opportunities faster. This forecast was sent to current I Know First subscribers.
How to interpret this diagram
Algorithmic Stock Forecast: The table on the left is a stock forecast produced by I Know First’s algorithm. Each day, subscribers receive forecasts for six different time horizons. Note that the top 10 stocks in the 1-month forecast may be different than those in the 1-year forecast. In the included table, only the relevant stocks have been included. The boxes are arranged according to their respective signal and predictability values (see below for detailed definitions). A green box represents a positive forecast, suggesting a long position, while a red represents a negative forecast, suggesting a short position.
Please note-for trading decisions use the most recent forecast. Get today’s forecast and Top stock picks.


