
Stock Forecasting Based on Big Data: Returns up to 78.19% in 1 Year
Stock Forecasting
The Fundamental Package includes our algorithmic forecasts for stocks screened by fundamental criteria. Our stock forecasting algorithm helps you find best opportunities for both long and short positions for the stocks within each fundamental screen. The stocks are selected according to five basic valuation categories:
- P/E (price to earnings ratio)
- PEG (price/earnings to growth ratio)
- price-to-book ratio
- price-to-sales ratio
- short ratio

Package Name: Fundamental – Low Price-to-Sales ratio Stocks
Recommended Positions: Long
Forecast Length: 1 Year (12/9/2018 – 12/9/2019)
I Know First Average: 23.74%

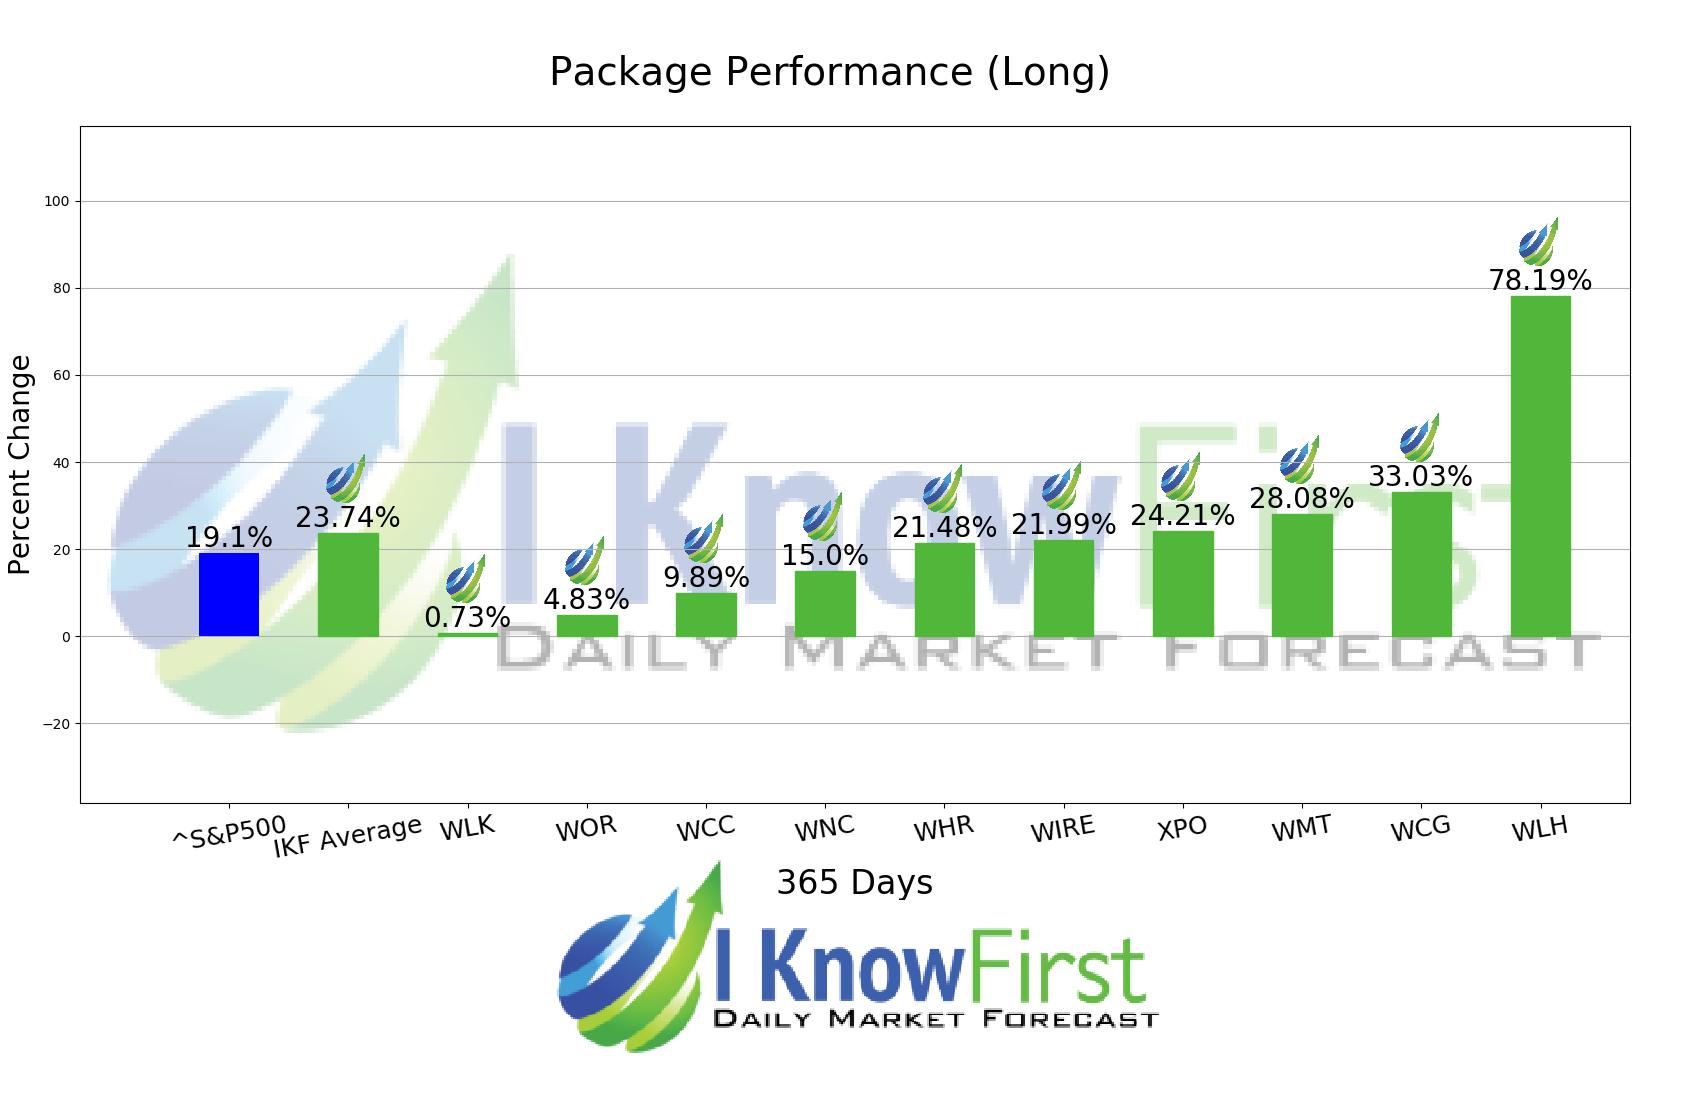
This Fundamental – Low Price-to-Sales ratio Stocks Package forecast had correctly predicted 10 out of 10 stock movements. WLH was our best stock pick this week a return of 78.19%. WCG and WMT saw outstanding returns of 33.03% and 28.08%. The package had an overall average return of 23.74%, providing investors with a premium of 4.64% over the S&P 500’s return of 19.1% during the same period.
William Lyon Homes, together with its subsidiaries, designs, constructs, markets, and sells single-family detached and attached homes in California, Arizona, Nevada, Colorado, Washington, and Oregon. The company sells its homes primarily to entry-level, first-time move-up and second-time move-up homebuyers under the Village Homes and Polygon Northwest Homes brands through in-house commissioned sales personnel and outside brokers. As of December 31, 2015, the company owned approximately 13,479 lots; and had options to purchase an additional 3,935 lots. William Lyon Homes was founded in 1954 and is headquartered in Newport Beach, California.
Algorithmic traders utilize these daily forecasts by the I Know First market prediction system as a tool to enhance portfolio performance, verify their own analysis and act on market opportunities faster. This forecast was sent to current I Know First subscribers.
How to interpret this diagram
Algorithmic Stock Forecast: The table on the left is a stock forecast produced by I Know First’s algorithm. Each day, subscribers receive forecasts for six different time horizons. Note that the top 10 stocks in the 1-month forecast may be different than those in the 1-year forecast. In the included table, only the relevant stocks have been included. The boxes are arranged according to their respective signal and predictability values (see below for detailed definitions). A green box represents a positive forecast, suggesting a long position, while a red represents a negative forecast, suggesting a short position.
Please note-for trading decisions use the most recent forecast. Get today’s forecast and Top stock picks.


