Stock Analysis Based on Pattern Recognition: Returns up to 46.57% in 14 Days
Stock Analysis
This Retail Stocks forecast is designed for investors and analysts who need stock analysis with predictions for the best stocks to invest in the retail estate sector (see Retail Stocks Package). It includes 20 stocks with bullish and bearish signals:
- Top 10 Retail stocks for the long position
- Top 10 Retail stocks for the short position
Package Name: Retail Stocks
Recommended Positions: Long
Forecast Length: 14 Days (12/17/2019 – 12/31/2019)
I Know First Average: 6.99%
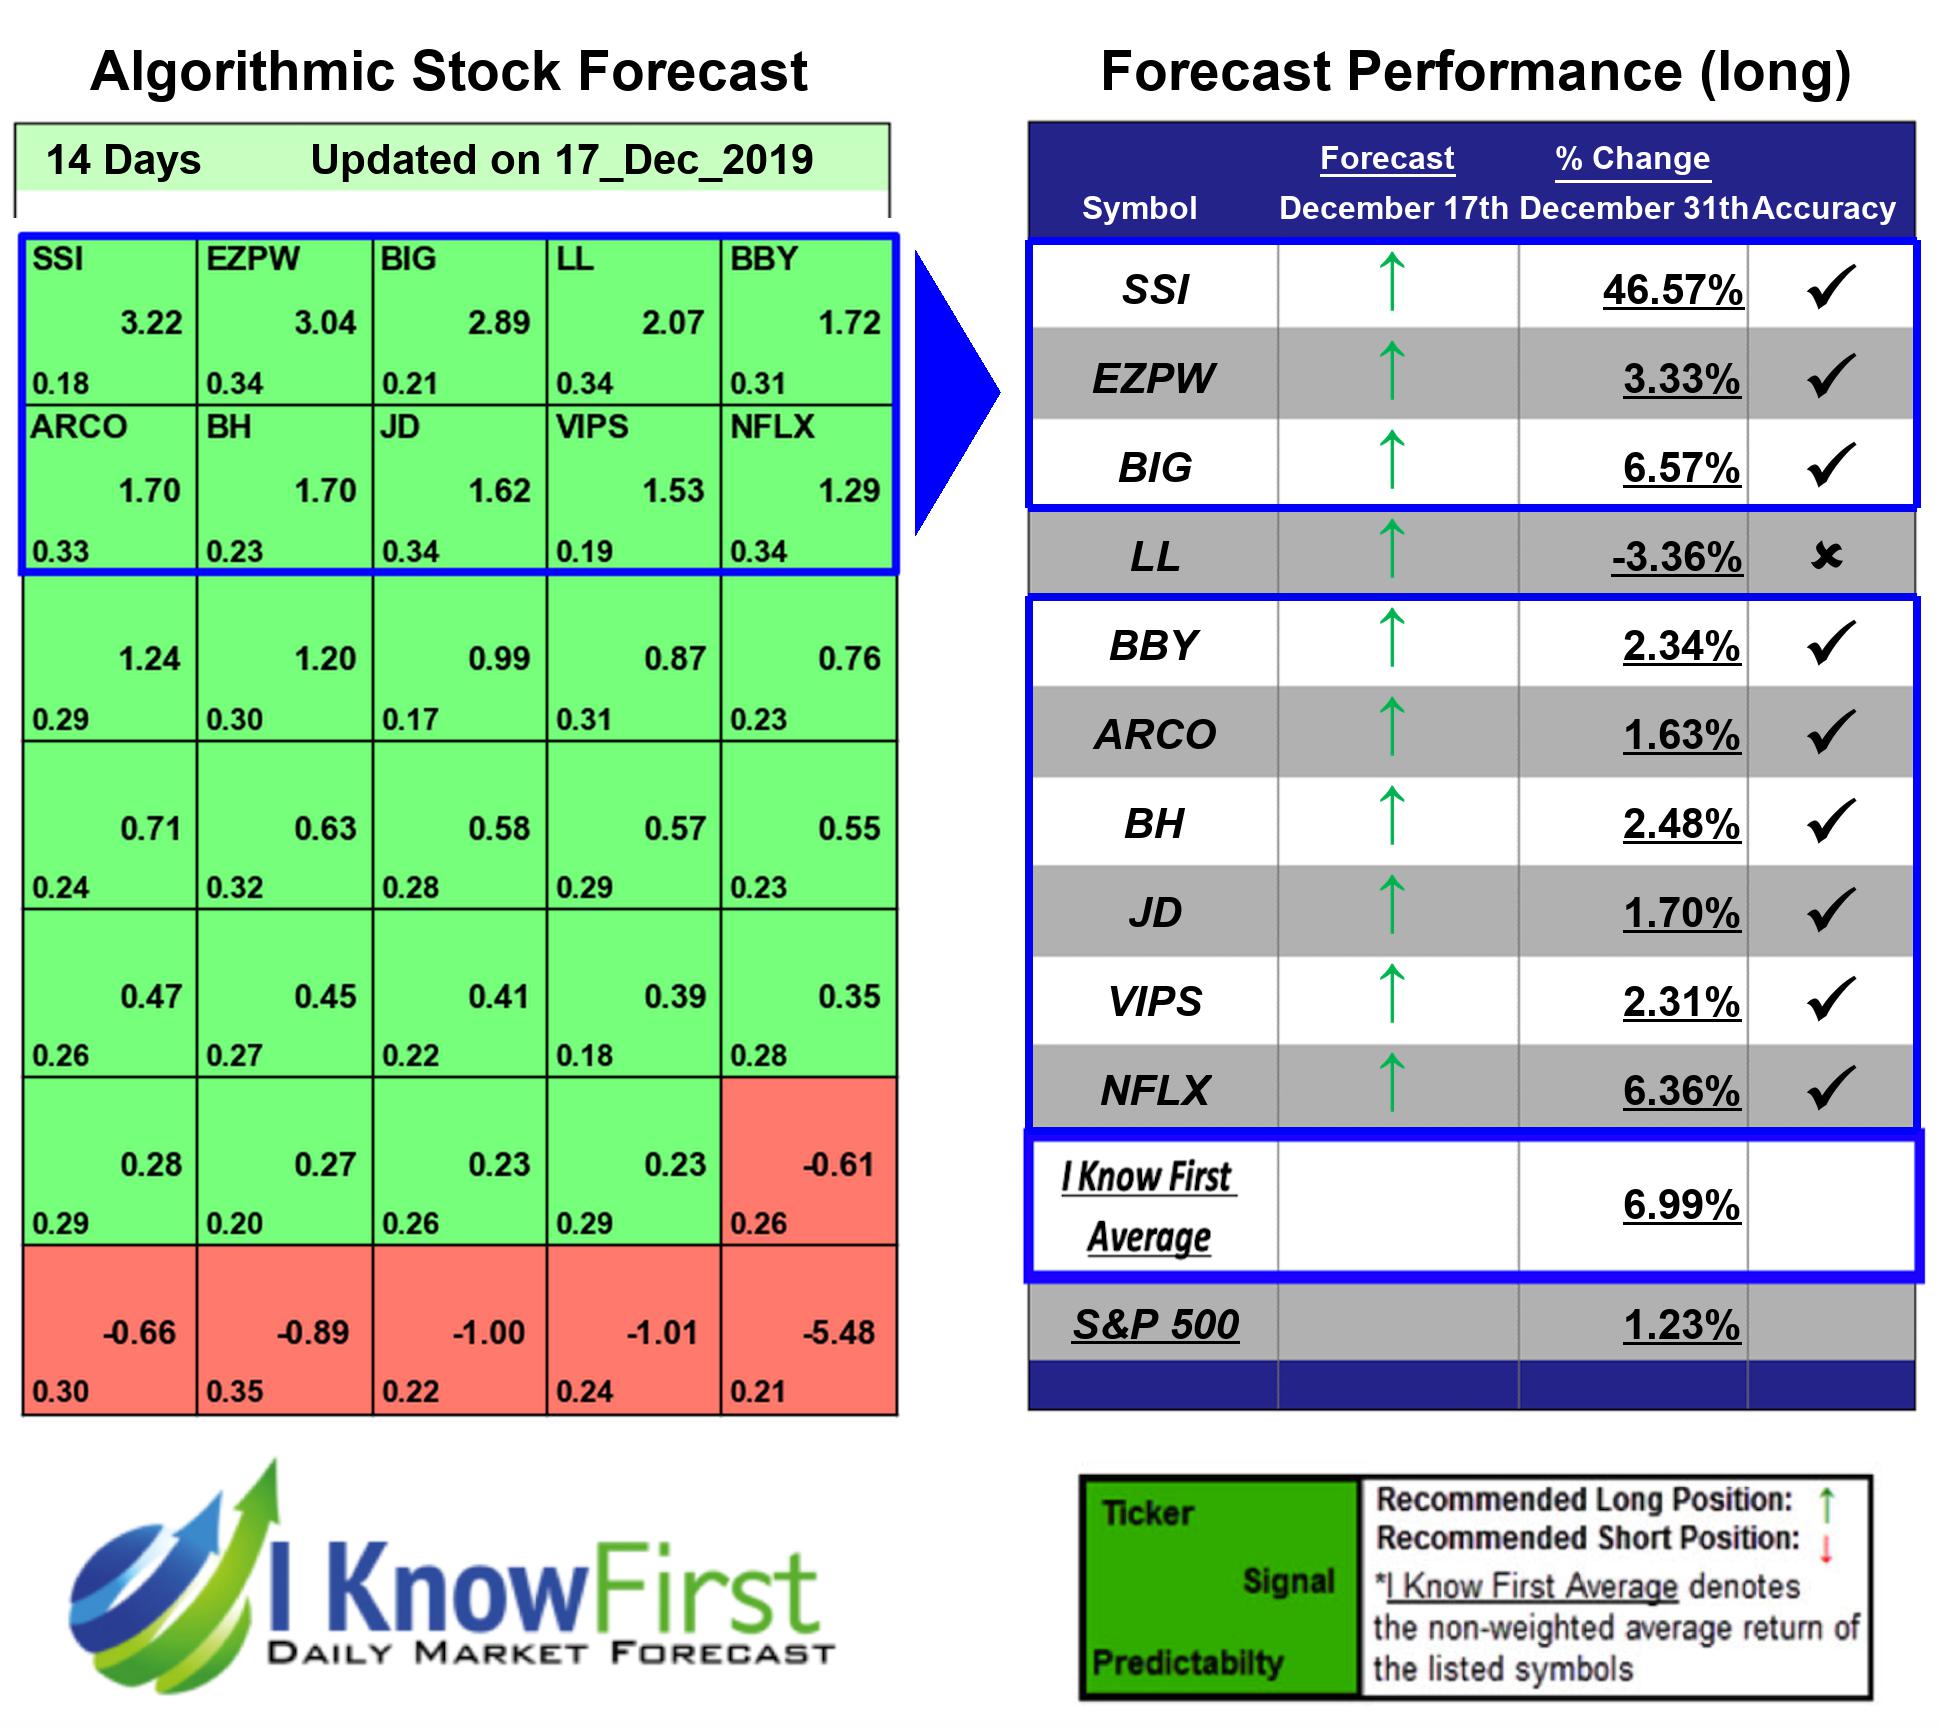

During the 14 Days forecasted period several picks in the Retail Stocks Package saw significant returns. The algorithm had correctly predicted 9 out 10 returns. The top-performing prediction in this forecast was SSI, which registered a return of 46.57%. Additional high returns came from BIG and NFLX, at 6.57% and 6.36% respectively. The overall average return in this Retail Stocks package was 6.99%, providing investors with a 5.76% premium over the S&P 500’s return of 1.23% during the same period.
Stage Stores, Inc. (SSI) operates as a specialty department store retailer in small and mid-sized towns and communities in the United States. Its merchandise portfolio comprises moderately priced brand name and private label apparel, accessories, cosmetics, footwear, and home goods. The company also offers merchandise direct-to-consumer through its e-commerce Website and send program. As of January 30, 2016, it operated 834 specialty department stores in 39 states and a direct-to-consumer channel under the BEALLS, GOODY’S, PALAIS ROYAL, PEEBLES, and STAGE nameplates. The company was founded in 1988 and is headquartered in Houston, Texas.
Algorithmic traders utilize these daily forecasts by the I Know First market prediction system as a tool to enhance portfolio performance, verify their own analysis and act on market opportunities faster. This forecast was sent to current I Know First subscribers.
How to interpret this diagram
Algorithmic Stock Forecast: The table on the left is a stock forecast produced by I Know First’s algorithm. Each day, subscribers receive forecasts for six different time horizons. Note that the top 10 stocks in the 1-month forecast may be different than those in the 1-year forecast. In the included table, only the relevant stocks have been included. The boxes are arranged according to their respective signal and predictability values (see below for detailed definitions). A green box represents a positive forecast, suggesting a long position, while a red represents a negative forecast, suggesting a short position.
Please note-for trading decisions use the most recent forecast. Get today’s forecast and Top stock picks.